33
/pt/
AIzaSyB4mHJ5NPEv-XzF7P6NDYXjlkCWaeKw5bc
November 1, 2025
70590
Argentina
ARG
true
2
1
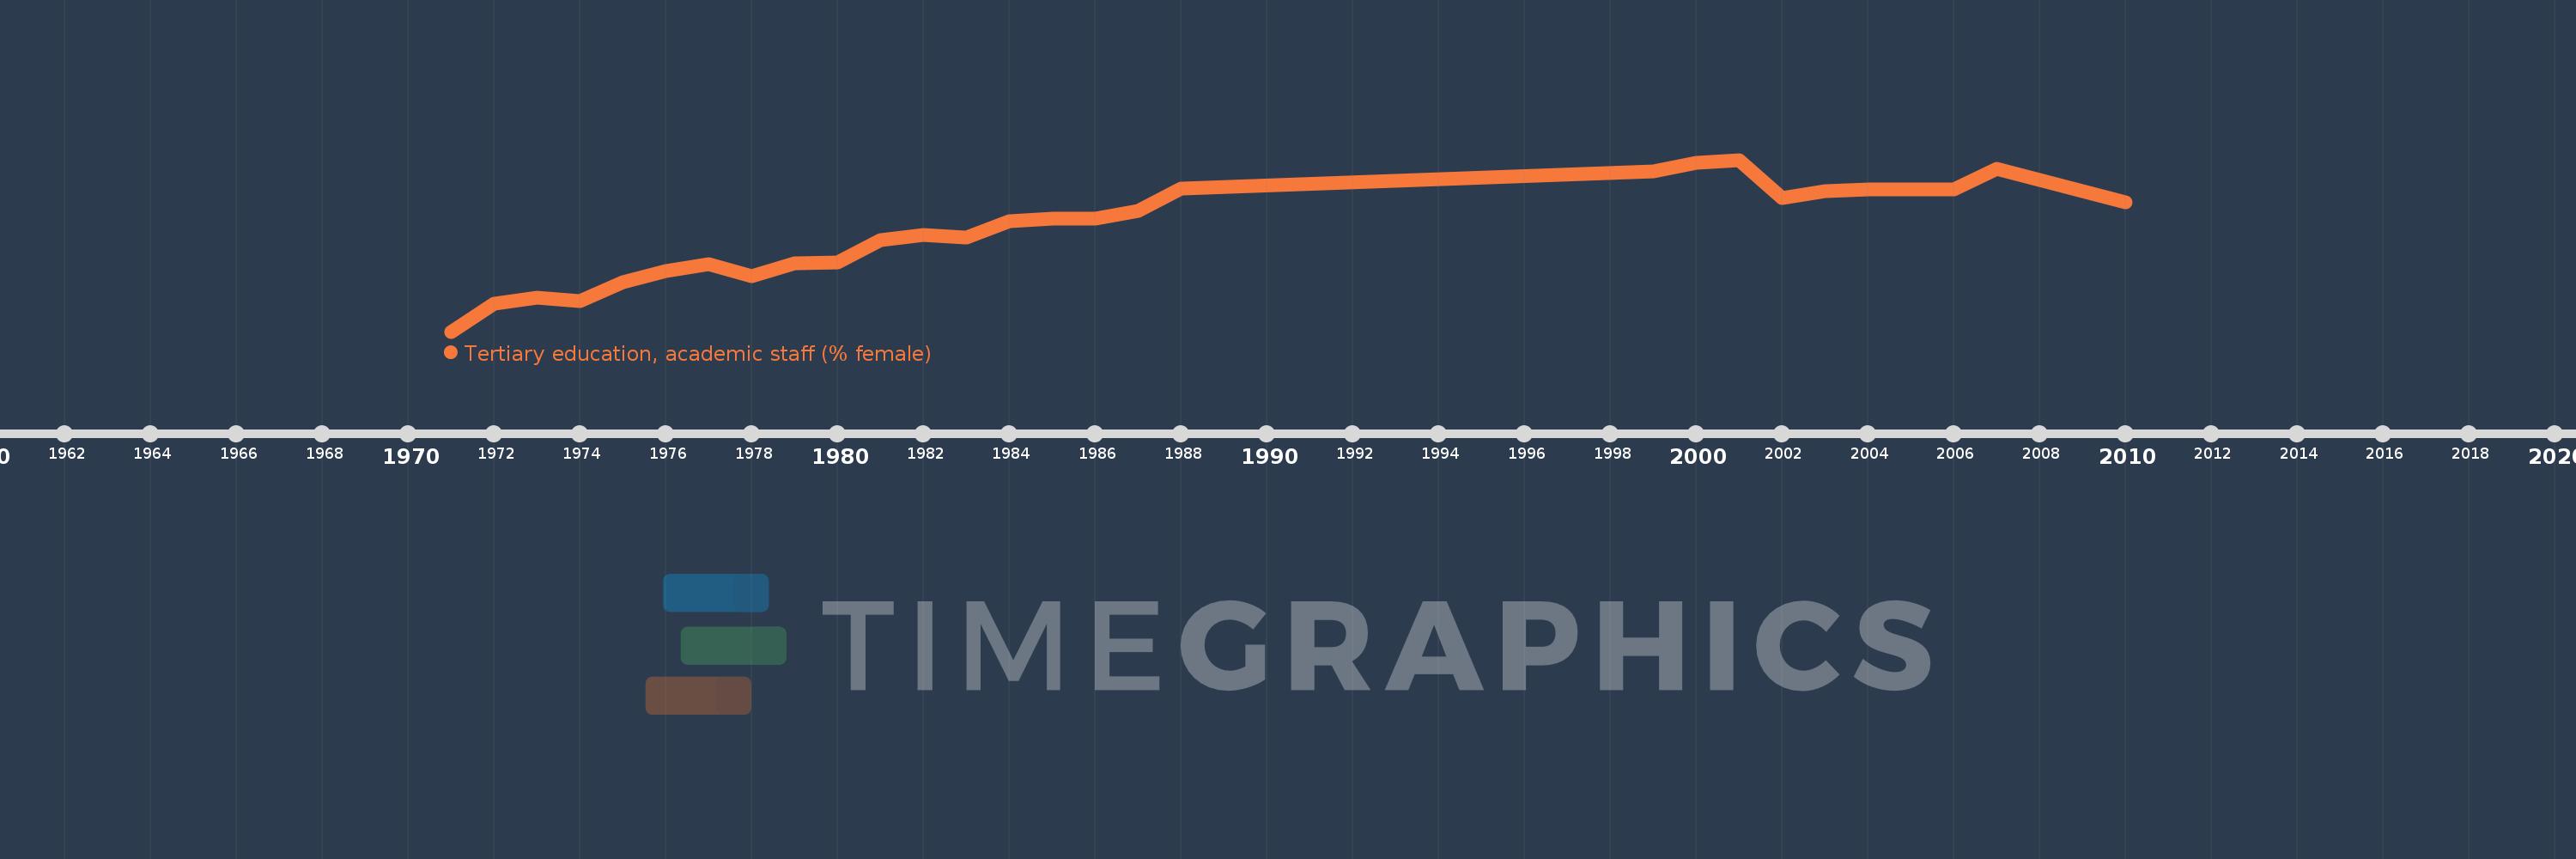
Tertiary education, academic staff (% female)
2010,2007,2006,2005,2004,2003,2002,2001,2000,1999,1988,1987,1986,1985,1984,1983,1982,1981,1980,1979,1978,1977,1976,1975,1974,1973,1972,1971