29
/pt/
pt
AIzaSyAYiBZKx7MnpbEhh9jyipgxe19OcubqV5w
April 1, 2024
111697
Congo, Rep.
COG
true
2
1
Tertiary education, academic staff (% female)
2013,2012,2010,2003,2002,2001,2000,1993,1992,1985,1984,1983,1982,1981,1979,1977,1976,1975,1974,1973,1972
Download
Biblioteca de estatísticas globais →Congo, Rep. →

Tertiary education, academic staff (% female)

Estas estatísticas em outros países:
AfghanistanAlbaniaAlgeriaAndorraAngolaAntigua and BarbudaArab WorldArgentinaArmeniaArubaAustraliaAustriaAzerbaijanBahamas, TheBahrainBangladeshBarbadosBelarusBelgiumBelizeBeninBermudaBhutanBoliviaBosnia and HerzegovinaBotswanaBrazilBritish Virgin IslandsBrunei DarussalamBulgariaBurkina FasoBurundiCabo VerdeCambodiaCameroonCanadaCaribbean small statesCayman IslandsCentral African RepublicCentral Europe and the BalticsChadChileChinaColombiaComorosCongo, Dem. Rep.Congo, Rep.Costa RicaCote d'IvoireCroatiaCubaCyprusCzech RepublicDenmarkDjiboutiDominicaDominican RepublicEarly-demographic dividendEast Asia & PacificEast Asia & Pacific (excluding high income)East Asia & Pacific (IDA & IBRD countries)EcuadorEgypt, Arab Rep.El SalvadorEquatorial GuineaEritreaEstoniaEthiopiaEuro areaEurope & Central AsiaEurope & Central Asia (excluding high income)Europe & Central Asia (IDA & IBRD countries)European UnionFijiFinlandFragile and conflict affected situationsFranceGabonGambia, TheGeorgiaGermanyGhanaGreeceGrenadaGuineaGuyanaHaitiHeavily indebted poor countries (HIPC)High incomeHondurasHong Kong SAR, ChinaHungaryIBRD onlyIcelandIDA & IBRD totalIDA blendIDA onlyIDA totalIndiaIndonesiaIran, Islamic Rep.IraqIrelandItalyJamaicaJapanJordanKazakhstanKorea, Dem. People’s Rep.Korea, Rep.KuwaitKyrgyz RepublicLao PDRLate-demographic dividendLatin America & Caribbean Latin America & Caribbean (excluding high income)Latin America & the Caribbean (IDA & IBRD countries)LatviaLeast developed countries: UN classificationLebanonLesothoLiberiaLibyaLiechtensteinLithuaniaLow & middle incomeLow incomeLower middle incomeLuxembourgMacao SAR, ChinaMacedonia, FYRMadagascarMalawiMalaysiaMaldivesMaliMaltaMarshall IslandsMauritaniaMauritiusMicronesia, Fed. Sts.Middle East & North AfricaMiddle East & North Africa (excluding high income)Middle East & North Africa (IDA & IBRD countries)Middle incomeMoldovaMongoliaMoroccoMozambiqueMyanmarNamibiaNepalNetherlandsNew ZealandNicaraguaNigerNigeriaNorth AmericaNorwayOECD membersOmanOther small statesPacific island small statesPakistanPalauPanamaPapua New GuineaPeruPhilippinesPolandPortugalPost-demographic dividendPre-demographic dividendPuerto RicoQatarRomaniaRussian FederationRwandaSamoaSao Tome and PrincipeSaudi ArabiaSenegalSerbiaSeychellesSierra LeoneSingaporeSint Maarten (Dutch part)Slovak RepublicSloveniaSmall statesSomaliaSouth AfricaSouth AsiaSouth Asia (IDA & IBRD)SpainSri LankaSt. Kitts and NevisSt. LuciaSt. Vincent and the GrenadinesSub-Saharan Africa Sub-Saharan Africa (excluding high income)Sub-Saharan Africa (IDA & IBRD countries)SudanSurinameSwazilandSwedenSwitzerlandSyrian Arab RepublicTajikistanTanzaniaThailandTimor-LesteTogoTongaTrinidad and TobagoTunisiaTurkeyTurkmenistanUgandaUnited Arab EmiratesUnited KingdomUnited StatesUpper middle incomeUruguayUzbekistanVenezuela, RBVietnamWest Bank and GazaWorldYemen, Rep.Zimbabwe
Linha do tempo:
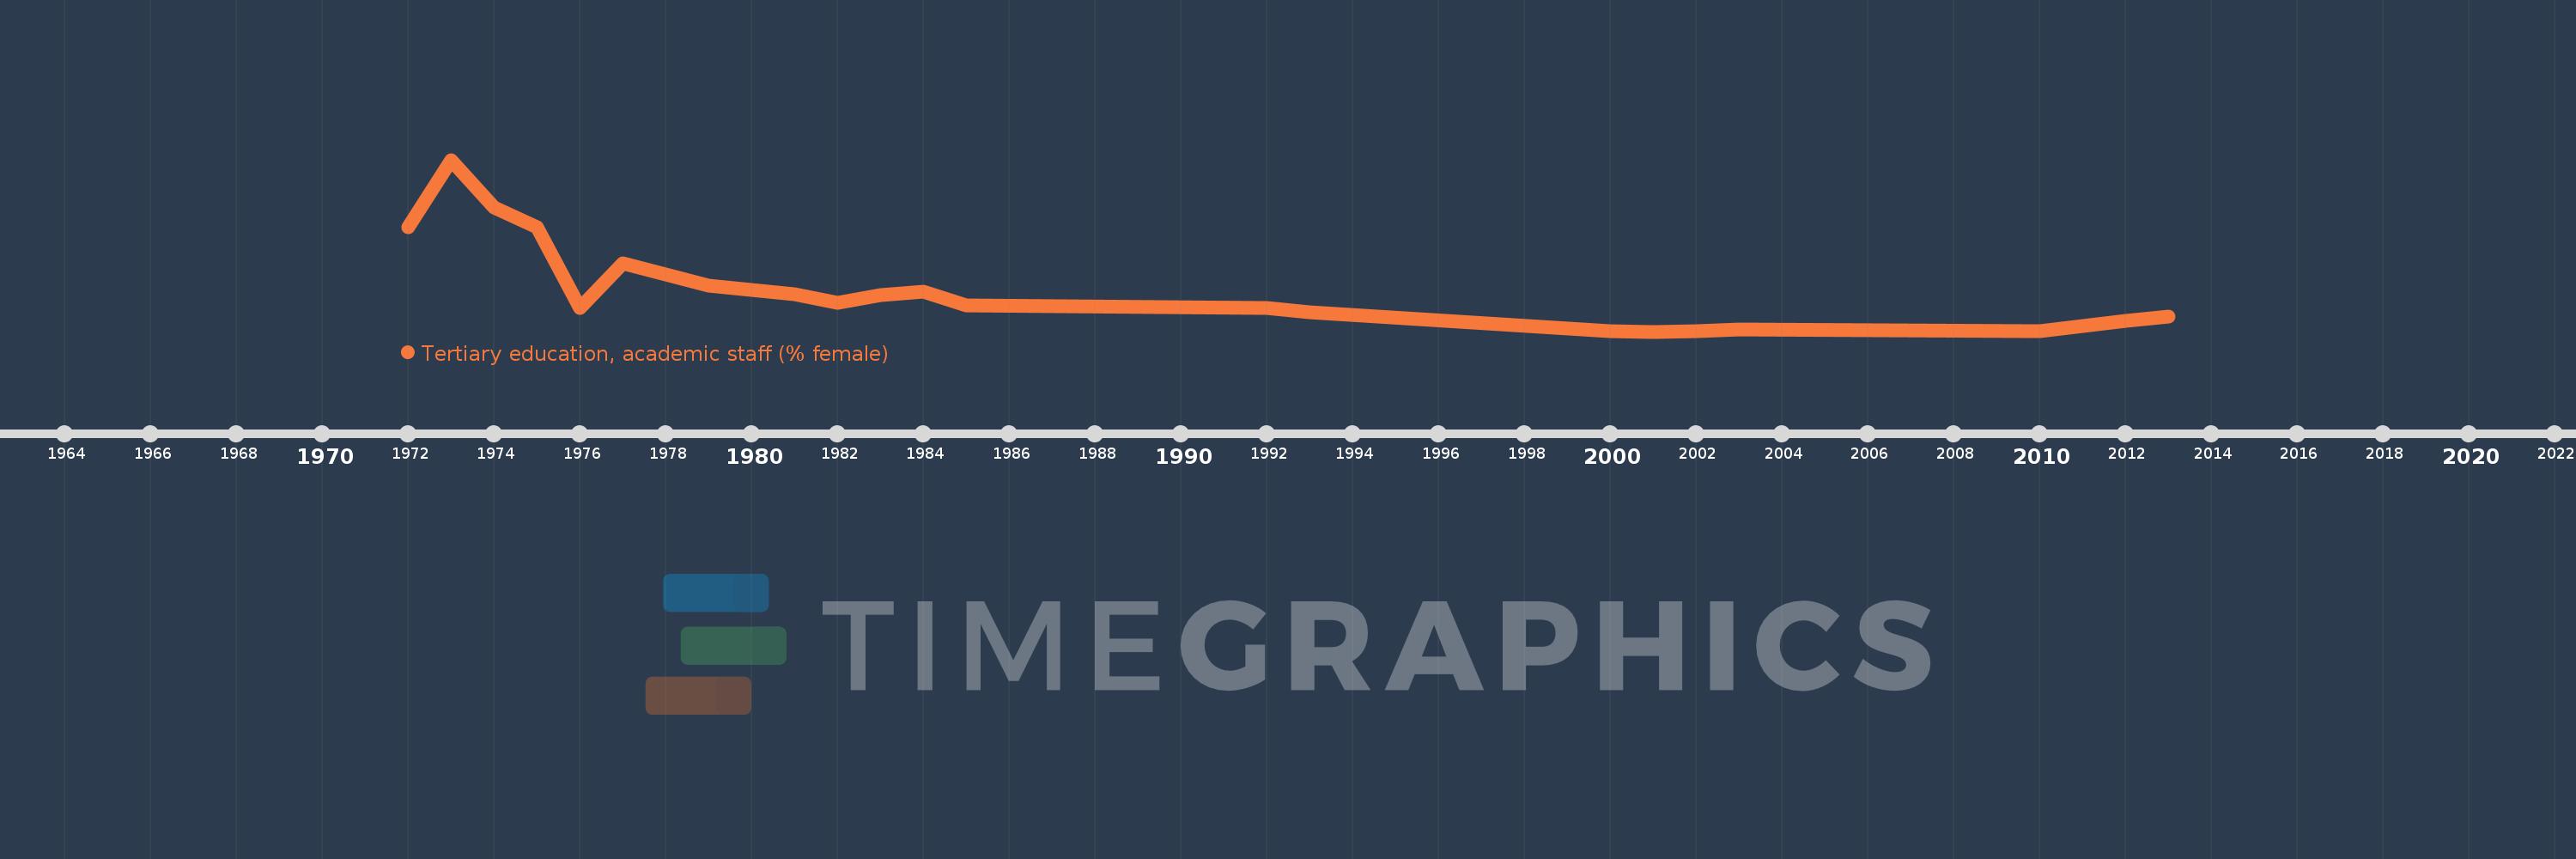
Nesta escala de tempo está apresentado um gráfico de 1972 ano até 2013 ano Congo, Rep.. Dados de 1971 ano ausente. O número de observações reais por data: 21.
Fonte (nome):
Indicadores de desenvolvimento mundial
Fonte (organização):
United Nations Educational, Scientific, and Cultural Organization (UNESCO) Institute for Statistics.
Categorias:
Education
Foi atualizado:
23 abr 2017 ano
Indicadores de alterações dos valores ao longo dos anos
Em média:
11.239
Mínimo:
4.961
1 jan 2001 ano
Máximo:
30.597
1 jan 1973 ano
Na data de observação
Valor
Mudança absoluta
A alteração em relação ao valor anterior
1 jan 1972 ano
20.513
+20.513
0.0%
1 jan 1973 ano
30.597
+10.084
49.16%
1 jan 1974 ano
23.448
-7.149
-23.36%
1 jan 1975 ano
20.482
-2.966
-12.65%
1 jan 1976 ano
8.444
-12.037
-58.77%
1 jan 1977 ano
15.152
+6.707
79.43%
1 jan 1979 ano
11.811
-3.34
-22.05%
1 jan 1981 ano
10.596
-1.215
-10.29%
1 jan 1982 ano
9.247
-1.349
-12.74%
1 jan 1983 ano
10.452
+1.205
13.04%
1 jan 1984 ano
10.88
+0.428
4.09%
1 jan 1985 ano
8.85
-2.03
-18.66%
1 jan 1992 ano
8.543
-0.306
-3.46%
1 jan 1993 ano
7.852
-0.692
-8.1%
1 jan 2000 ano
4.977
-2.874
-36.61%
1 jan 2001 ano
4.961
-0.016
-0.32%
1 jan 2002 ano
5.012
+0.051
1.03%
1 jan 2003 ano
5.269
+0.257
5.13%
1 jan 2010 ano
5.043
-0.226
-4.3%
1 jan 2012 ano
6.626
+1.583
31.39%
1 jan 2013 ano
7.266
+0.64
9.65%
Classificação de países por estatísticas atuais por anos

Comentários:

Enviar
PremiumAbout & FeedbackAcordoPrivacidade
logo
© 2022 Selected Technologies LLC – Morgan Hill, California