33
/pt/
AIzaSyB4mHJ5NPEv-XzF7P6NDYXjlkCWaeKw5bc
November 1, 2025
164322
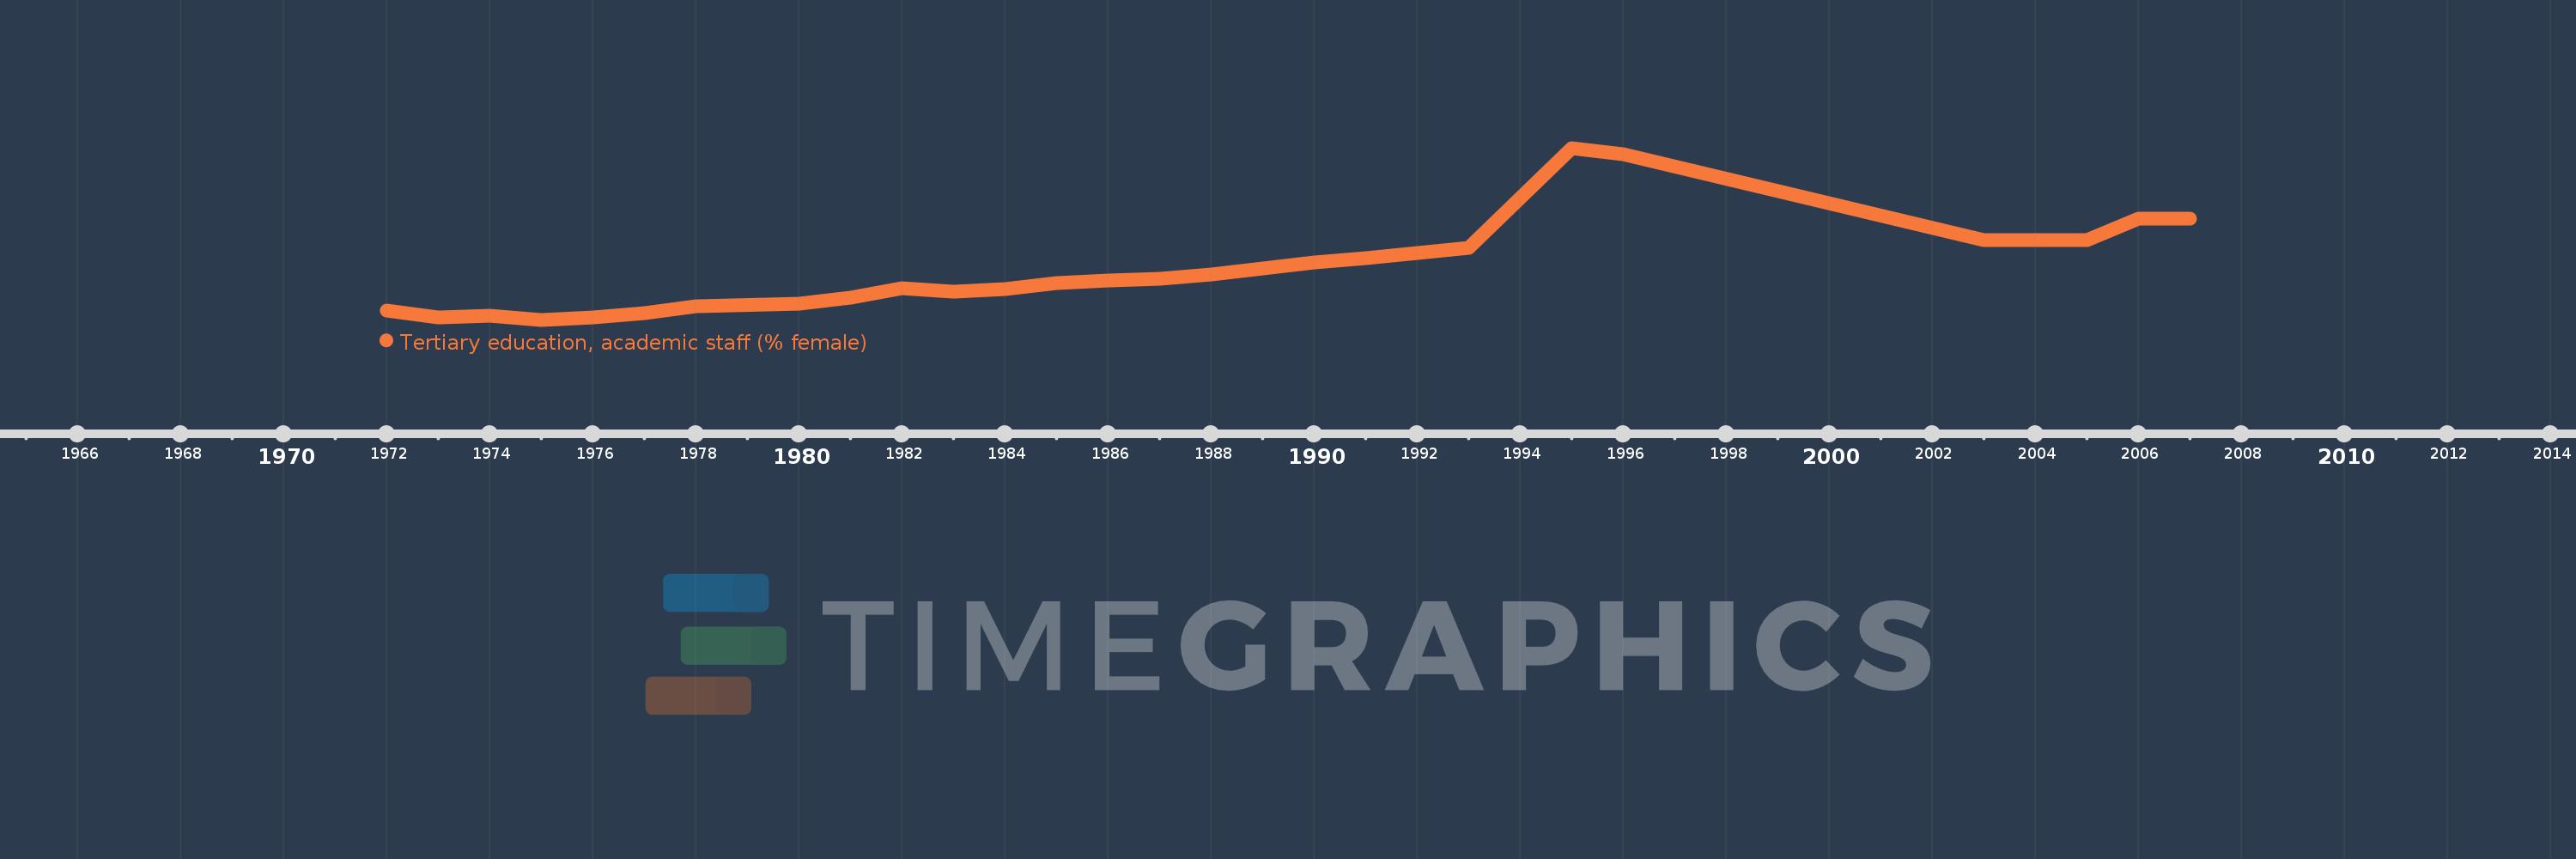
Japan
JPN
true
2
1
Tertiary education, academic staff (% female)
2007,2006,2005,2004,2003,1996,1995,1993,1991,1990,1989,1988,1987,1986,1985,1984,1983,1982,1981,1980,1978,1977,1976,1975,1974,1973,1972