30
/pt/
AIzaSyAYiBZKx7MnpbEhh9jyipgxe19OcubqV5w
April 1, 2024
65533
Albania
ALB
true
2
1
Total reserves (% of total external debt)
2016,2015,2014,2013,2012,2011,2010,2009,2008,2007,2006,2005,2004,2003,2002,2001,2000,1999,1998,1997,1996,1995,1994
Download
Biblioteca de estatísticas globais →Albania →

Total reserves (% of total external debt)

Estas estatísticas em outros países:

AfghanistanAlbaniaAlgeriaAngolaArab WorldArgentinaArmeniaAzerbaijanBangladeshBelarusBelizeBeninBhutanBoliviaBosnia and HerzegovinaBotswanaBrazilBulgariaBurkina FasoBurundiCabo VerdeCambodiaCameroonCaribbean small statesCentral African RepublicCentral Europe and the BalticsChadChinaColombiaComorosCongo, Dem. Rep.Congo, Rep.Costa RicaCote d'IvoireDjiboutiDominicaDominican RepublicEarly-demographic dividendEast Asia & PacificEast Asia & Pacific (excluding high income)East Asia & Pacific (IDA & IBRD countries)EcuadorEgypt, Arab Rep.El SalvadorEritreaEthiopiaEurope & Central AsiaEurope & Central Asia (excluding high income)Europe & Central Asia (IDA & IBRD countries)FijiFragile and conflict affected situationsGabonGambia, TheGeorgiaGhanaGrenadaGuatemalaGuineaGuinea-BissauGuyanaHaitiHeavily indebted poor countries (HIPC)HondurasIBRD onlyIDA & IBRD totalIDA blendIDA onlyIDA totalIndiaIndonesiaIran, Islamic Rep.JamaicaJordanKazakhstanKenyaKosovoKyrgyz RepublicLao PDRLate-demographic dividendLatin America & Caribbean Latin America & Caribbean (excluding high income)Latin America & the Caribbean (IDA & IBRD countries)Least developed countries: UN classificationLebanonLesothoLiberiaLow & middle incomeLow incomeLower middle incomeMacedonia, FYRMadagascarMalawiMalaysiaMaldivesMaliMauritaniaMauritiusMexicoMiddle East & North AfricaMiddle East & North Africa (excluding high income)Middle East & North Africa (IDA & IBRD countries)Middle incomeMoldovaMongoliaMontenegroMoroccoMozambiqueMyanmarNepalNicaraguaNigerNigeriaOther small statesPacific island small statesPakistanPanamaPapua New GuineaParaguayPeruPhilippinesPre-demographic dividendRomaniaRussian FederationRwandaSamoaSao Tome and PrincipeSenegalSerbiaSierra LeoneSmall statesSolomon IslandsSouth AfricaSouth AsiaSouth Asia (IDA & IBRD)Sri LankaSt. LuciaSt. Vincent and the GrenadinesSub-Saharan Africa Sub-Saharan Africa (excluding high income)Sub-Saharan Africa (IDA & IBRD countries)SudanSwazilandSyrian Arab RepublicTajikistanTanzaniaThailandTogoTongaTunisiaTurkeyUgandaUkraineUpper middle incomeVanuatuVenezuela, RBVietnamYemen, Rep.ZambiaZimbabwe

Linha do tempo:

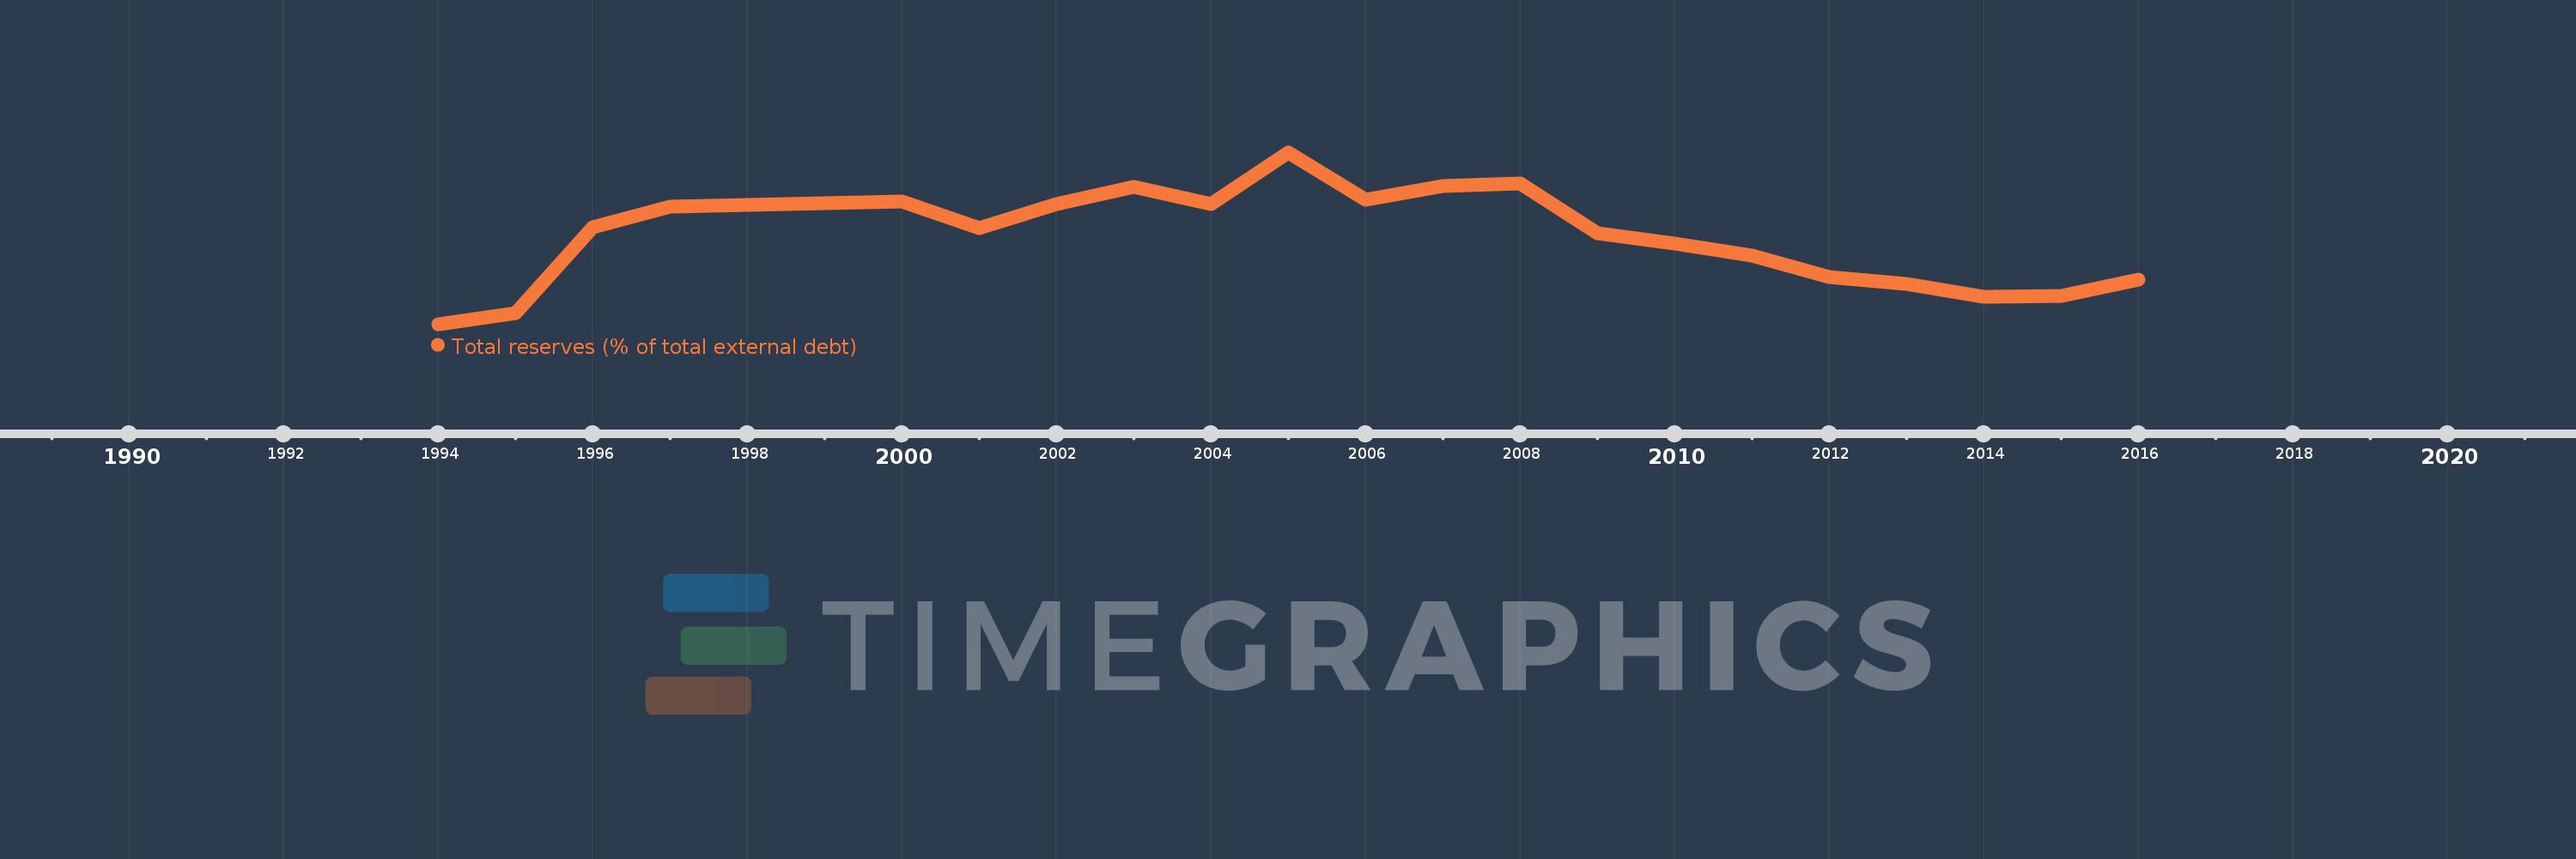
Nesta escala de tempo está apresentado um gráfico de 1994 ano até 2016 ano Albania. Dados de 1993 ano ausente. O número de observações reais por data: 23.

Fonte (nome):

Indicadores de desenvolvimento mundial

Fonte (organização):

World Bank, International Debt Statistics.

Categorias:

Financial Sector, External Debt

Foi atualizado:

23 abr 2017 ano

Indicadores de alterações dos valores ao longo dos anos

Em média:
55.189
Mínimo:
21.184
1 jan 1994 ano
Máximo:
86.289
1 jan 2005 ano
Na data de observação
Valor
Mudança absoluta
A alteração em relação ao valor anterior
1 jan 1994 ano
21.184
+21.184
0.0%
1 jan 1995 ano
25.319
+4.135
19.52%
1 jan 1996 ano
57.817
+32.498
128.35%
1 jan 1997 ano
65.728
+7.911
13.68%
1 jan 1998 ano
66.3
+0.572
0.87%
1 jan 1999 ano
67.018
+0.718
1.08%
1 jan 2000 ano
67.665
+0.647
0.96%
1 jan 2001 ano
57.584
-10.081
-14.9%
1 jan 2002 ano
66.721
+9.137
15.87%
1 jan 2003 ano
73.336
+6.614
9.91%
1 jan 2004 ano
66.857
-6.478
-8.83%
1 jan 2005 ano
86.289
+19.432
29.06%
1 jan 2006 ano
68.422
-17.867
-20.71%
1 jan 2007 ano
73.419
+4.997
7.3%
1 jan 2008 ano
74.491
+1.072
1.46%
1 jan 2009 ano
55.718
-18.773
-25.2%
1 jan 2010 ano
51.589
-4.129
-7.41%
1 jan 2011 ano
47.258
-4.331
-8.4%
1 jan 2012 ano
39.139
-8.12
-17.18%
1 jan 2013 ano
36.31
-2.829
-7.23%
1 jan 2014 ano
31.494
-4.815
-13.26%
1 jan 2015 ano
31.732
+0.238
0.76%
1 jan 2016 ano
37.954
+6.222
19.61%

Classificação de países por estatísticas atuais por anos