33
/pt/
AIzaSyAYiBZKx7MnpbEhh9jyipgxe19OcubqV5w
August 1, 2025
230528
Russian Federation
RUS
true
2
1
Total reserves (% of total external debt)
2016,2015,2014,2013,2012,2011,2010,2009,2008,2007,2006,2005,2004,2003,2002,2001,2000,1999,1998,1997,1996,1995,1994
Download
Biblioteca de estatísticas globais →Russian Federation →

Total reserves (% of total external debt)

Estas estatísticas em outros países:

AfghanistanAlbaniaAlgeriaAngolaArab WorldArgentinaArmeniaAzerbaijanBangladeshBelarusBelizeBeninBhutanBoliviaBosnia and HerzegovinaBotswanaBrazilBulgariaBurkina FasoBurundiCabo VerdeCambodiaCameroonCaribbean small statesCentral African RepublicCentral Europe and the BalticsChadChinaColombiaComorosCongo, Dem. Rep.Congo, Rep.Costa RicaCote d'IvoireDjiboutiDominicaDominican RepublicEarly-demographic dividendEast Asia & PacificEast Asia & Pacific (excluding high income)East Asia & Pacific (IDA & IBRD countries)EcuadorEgypt, Arab Rep.El SalvadorEritreaEthiopiaEurope & Central AsiaEurope & Central Asia (excluding high income)Europe & Central Asia (IDA & IBRD countries)FijiFragile and conflict affected situationsGabonGambia, TheGeorgiaGhanaGrenadaGuatemalaGuineaGuinea-BissauGuyanaHaitiHeavily indebted poor countries (HIPC)HondurasIBRD onlyIDA & IBRD totalIDA blendIDA onlyIDA totalIndiaIndonesiaIran, Islamic Rep.JamaicaJordanKazakhstanKenyaKosovoKyrgyz RepublicLao PDRLate-demographic dividendLatin America & Caribbean Latin America & Caribbean (excluding high income)Latin America & the Caribbean (IDA & IBRD countries)Least developed countries: UN classificationLebanonLesothoLiberiaLow & middle incomeLow incomeLower middle incomeMacedonia, FYRMadagascarMalawiMalaysiaMaldivesMaliMauritaniaMauritiusMexicoMiddle East & North AfricaMiddle East & North Africa (excluding high income)Middle East & North Africa (IDA & IBRD countries)Middle incomeMoldovaMongoliaMontenegroMoroccoMozambiqueMyanmarNepalNicaraguaNigerNigeriaOther small statesPacific island small statesPakistanPanamaPapua New GuineaParaguayPeruPhilippinesPre-demographic dividendRomaniaRussian FederationRwandaSamoaSao Tome and PrincipeSenegalSerbiaSierra LeoneSmall statesSolomon IslandsSouth AfricaSouth AsiaSouth Asia (IDA & IBRD)Sri LankaSt. LuciaSt. Vincent and the GrenadinesSub-Saharan Africa Sub-Saharan Africa (excluding high income)Sub-Saharan Africa (IDA & IBRD countries)SudanSwazilandSyrian Arab RepublicTajikistanTanzaniaThailandTogoTongaTunisiaTurkeyUgandaUkraineUpper middle incomeVanuatuVenezuela, RBVietnamYemen, Rep.ZambiaZimbabwe

Linha do tempo:

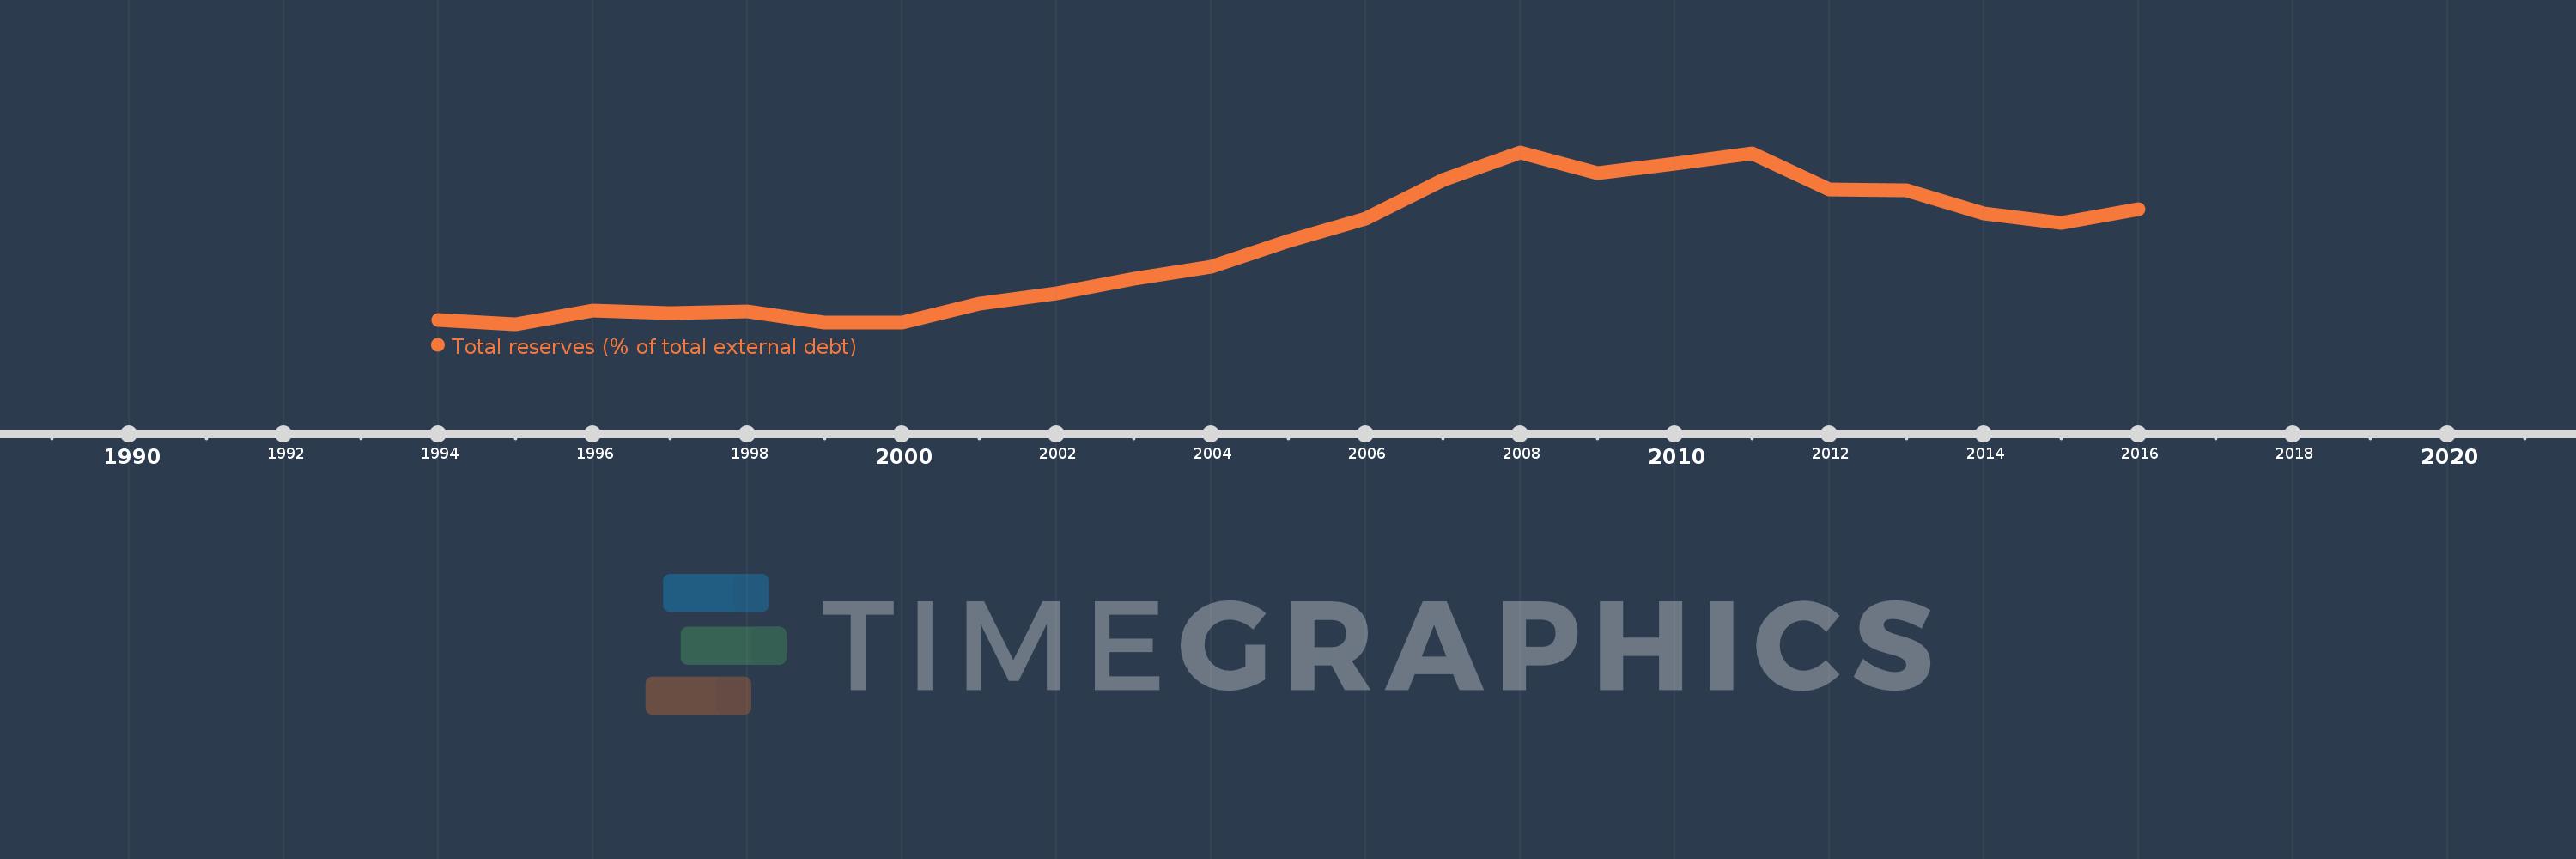
Nesta escala de tempo está apresentado um gráfico de 1994 ano até 2016 ano Russian Federation. Dados de 1993 ano ausente. O número de observações reais por data: 23.

Fonte (nome):

Indicadores de desenvolvimento mundial

Fonte (organização):

World Bank, International Debt Statistics.

Categorias:

Financial Sector, External Debt

Foi atualizado:

23 abr 2017 ano

Indicadores de alterações dos valores ao longo dos anos

Em média:
55.117
Mínimo:
5.89
1 jan 1995 ano
Máximo:
115.016
1 jan 2008 ano
Na data de observação
Valor
Mudança absoluta
A alteração em relação ao valor anterior
1 jan 1994 ano
8.731
+8.731
0.0%
1 jan 1995 ano
5.89
-2.841
-32.54%
1 jan 1996 ano
14.768
+8.877
150.71%
1 jan 1997 ano
12.801
-1.966
-13.31%
1 jan 1998 ano
13.753
+0.952
7.44%
1 jan 1999 ano
6.854
-6.9
-50.17%
1 jan 2000 ano
6.846
-0.008
-0.12%
1 jan 2001 ano
18.857
+12.011
175.46%
1 jan 2002 ano
25.719
+6.862
36.39%
1 jan 2003 ano
34.906
+9.187
35.72%
1 jan 2004 ano
42.177
+7.272
20.83%
1 jan 2005 ano
58.942
+16.765
39.75%
1 jan 2006 ano
72.958
+14.016
23.78%
1 jan 2007 ano
97.593
+24.635
33.77%
1 jan 2008 ano
115.016
+17.423
17.85%
1 jan 2009 ano
101.669
-13.347
-11.6%
1 jan 2010 ano
108.097
+6.428
6.32%
1 jan 2011 ano
114.676
+6.579
6.09%
1 jan 2012 ano
91.376
-23.301
-20.32%
1 jan 2013 ano
90.873
-0.503
-0.55%
1 jan 2014 ano
76.243
-14.629
-16.1%
1 jan 2015 ano
70.268
-5.975
-7.84%
1 jan 2016 ano
78.689
+8.42
11.98%

Classificação de países por estatísticas atuais por anos