33
/pt/
AIzaSyAYiBZKx7MnpbEhh9jyipgxe19OcubqV5w
August 1, 2025
274398
Ukraine
UKR
true
2
1
Total reserves (% of total external debt)
2016,2015,2014,2013,2012,2011,2010,2009,2008,2007,2006,2005,2004,2003,2002,2001,2000,1999,1998,1997,1996,1995,1994,1993
Download
Biblioteca de estatísticas globais →Ukraine →

Total reserves (% of total external debt)

Estas estatísticas em outros países:

AfghanistanAlbaniaAlgeriaAngolaArab WorldArgentinaArmeniaAzerbaijanBangladeshBelarusBelizeBeninBhutanBoliviaBosnia and HerzegovinaBotswanaBrazilBulgariaBurkina FasoBurundiCabo VerdeCambodiaCameroonCaribbean small statesCentral African RepublicCentral Europe and the BalticsChadChinaColombiaComorosCongo, Dem. Rep.Congo, Rep.Costa RicaCote d'IvoireDjiboutiDominicaDominican RepublicEarly-demographic dividendEast Asia & PacificEast Asia & Pacific (excluding high income)East Asia & Pacific (IDA & IBRD countries)EcuadorEgypt, Arab Rep.El SalvadorEritreaEthiopiaEurope & Central AsiaEurope & Central Asia (excluding high income)Europe & Central Asia (IDA & IBRD countries)FijiFragile and conflict affected situationsGabonGambia, TheGeorgiaGhanaGrenadaGuatemalaGuineaGuinea-BissauGuyanaHaitiHeavily indebted poor countries (HIPC)HondurasIBRD onlyIDA & IBRD totalIDA blendIDA onlyIDA totalIndiaIndonesiaIran, Islamic Rep.JamaicaJordanKazakhstanKenyaKosovoKyrgyz RepublicLao PDRLate-demographic dividendLatin America & Caribbean Latin America & Caribbean (excluding high income)Latin America & the Caribbean (IDA & IBRD countries)Least developed countries: UN classificationLebanonLesothoLiberiaLow & middle incomeLow incomeLower middle incomeMacedonia, FYRMadagascarMalawiMalaysiaMaldivesMaliMauritaniaMauritiusMexicoMiddle East & North AfricaMiddle East & North Africa (excluding high income)Middle East & North Africa (IDA & IBRD countries)Middle incomeMoldovaMongoliaMontenegroMoroccoMozambiqueMyanmarNepalNicaraguaNigerNigeriaOther small statesPacific island small statesPakistanPanamaPapua New GuineaParaguayPeruPhilippinesPre-demographic dividendRomaniaRussian FederationRwandaSamoaSao Tome and PrincipeSenegalSerbiaSierra LeoneSmall statesSolomon IslandsSouth AfricaSouth AsiaSouth Asia (IDA & IBRD)Sri LankaSt. LuciaSt. Vincent and the GrenadinesSub-Saharan Africa Sub-Saharan Africa (excluding high income)Sub-Saharan Africa (IDA & IBRD countries)SudanSwazilandSyrian Arab RepublicTajikistanTanzaniaThailandTogoTongaTunisiaTurkeyUgandaUkraineUpper middle incomeVanuatuVenezuela, RBVietnamYemen, Rep.ZambiaZimbabwe

Linha do tempo:

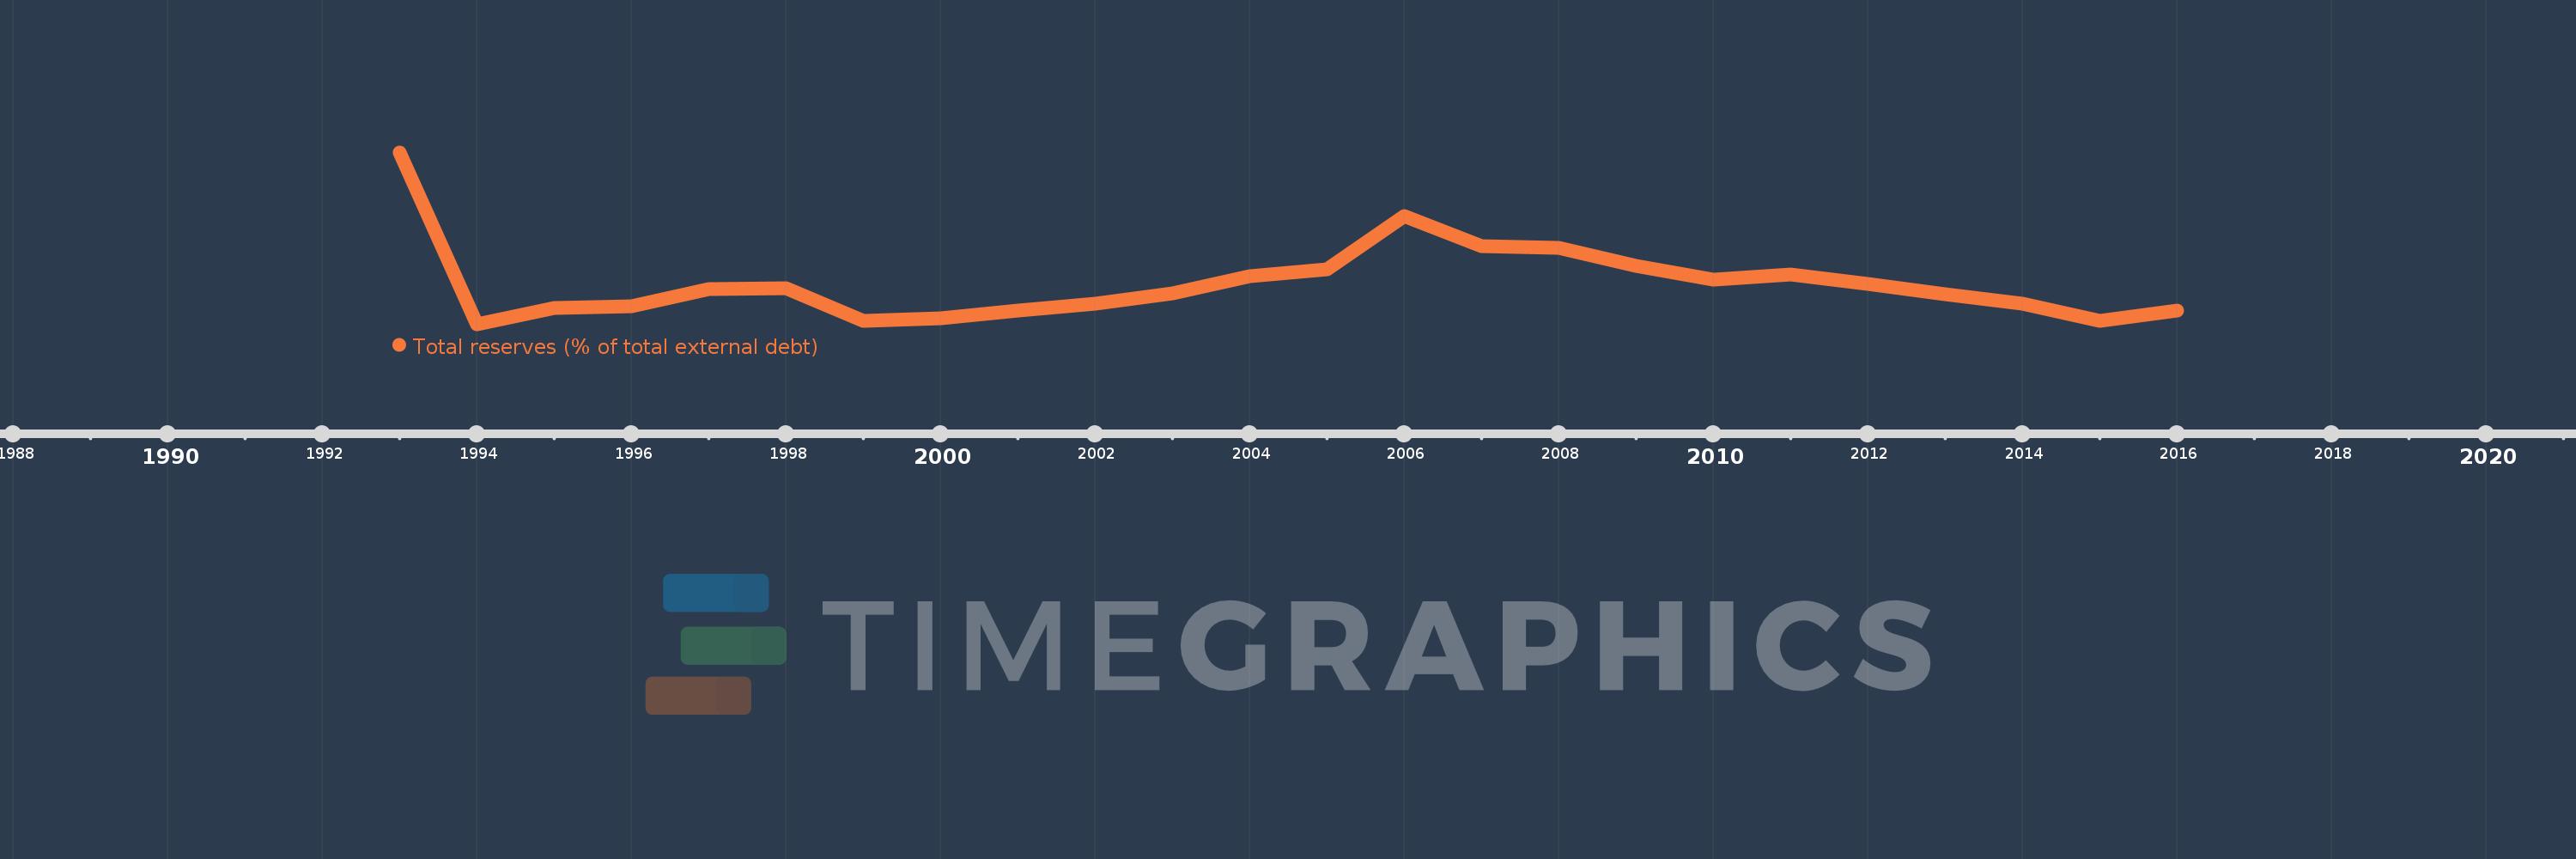
Nesta escala de tempo está apresentado um gráfico de 1993 ano até 2016 ano Ukraine. Dados de 1992 ano ausente. O número de observações reais por data: 24.

Fonte (nome):

Indicadores de desenvolvimento mundial

Fonte (organização):

World Bank, International Debt Statistics.

Categorias:

Financial Sector, External Debt

Foi atualizado:

23 abr 2017 ano

Indicadores de alterações dos valores ao longo dos anos

Em média:
23.474
Mínimo:
4.308
1 jan 1994 ano
Máximo:
85.15
1 jan 1993 ano
Na data de observação
Valor
Mudança absoluta
A alteração em relação ao valor anterior
1 jan 1993 ano
85.15
+85.15
0.0%
1 jan 1994 ano
4.308
-80.842
-94.94%
1 jan 1995 ano
11.79
+7.481
173.65%
1 jan 1996 ano
12.678
+0.888
7.54%
1 jan 1997 ano
20.67
+7.992
63.04%
1 jan 1998 ano
21.187
+0.517
2.5%
1 jan 1999 ano
6.067
-15.119
-71.36%
1 jan 2000 ano
6.944
+0.877
14.45%
1 jan 2001 ano
10.62
+3.676
52.94%
1 jan 2002 ano
13.912
+3.292
31.0%
1 jan 2003 ano
19.005
+5.093
36.61%
1 jan 2004 ano
26.86
+7.855
41.33%
1 jan 2005 ano
30.271
+3.412
12.7%
1 jan 2006 ano
55.244
+24.973
82.5%
1 jan 2007 ano
41.205
-14.04
-25.41%
1 jan 2008 ano
40.228
-0.976
-2.37%
1 jan 2009 ano
31.748
-8.48
-21.08%
1 jan 2010 ano
25.224
-6.525
-20.55%
1 jan 2011 ano
27.813
+2.59
10.27%
1 jan 2012 ano
23.466
-4.347
-15.63%
1 jan 2013 ano
18.591
-4.876
-20.78%
1 jan 2014 ano
13.825
-4.766
-25.63%
1 jan 2015 ano
5.746
-8.079
-58.44%
1 jan 2016 ano
10.829
+5.083
88.47%

Classificação de países por estatísticas atuais por anos