33
/pt/
AIzaSyAYiBZKx7MnpbEhh9jyipgxe19OcubqV5w
May 1, 2025
255492
Swaziland
SWZ
true
2
1
Net enrolment rate, secondary, both sexes (%)
2014,2013,2012,2011,2010,2008,2007,2006,2005,2004,2003,2002,2001,2000,1999,1978,1977,1976,1975,1973,1972,1971
Download
Biblioteca de estatísticas globais →Swaziland →

Net enrolment rate, secondary, both sexes (%)

Estas estatísticas em outros países:

AfghanistanAlbaniaAlgeriaAngolaAntigua and BarbudaArab WorldArgentinaArmeniaArubaAustraliaAustriaAzerbaijanBahamas, TheBahrainBangladeshBarbadosBelarusBelgiumBelizeBeninBermudaBhutanBoliviaBotswanaBrazilBritish Virgin IslandsBrunei DarussalamBulgariaBurkina FasoBurundiCabo VerdeCambodiaCameroonCanadaCaribbean small statesCentral African RepublicCentral Europe and the BalticsChadChileColombiaComorosCongo, Dem. Rep.Congo, Rep.Costa RicaCroatiaCubaCyprusDenmarkDjiboutiDominicaDominican RepublicEarly-demographic dividendEast Asia & PacificEast Asia & Pacific (excluding high income)East Asia & Pacific (IDA & IBRD countries)EcuadorEgypt, Arab Rep.El SalvadorEquatorial GuineaEritreaEstoniaEthiopiaEuro areaEurope & Central AsiaEurope & Central Asia (excluding high income)Europe & Central Asia (IDA & IBRD countries)European UnionFijiFinlandFragile and conflict affected situationsFranceGambia, TheGeorgiaGhanaGreeceGrenadaGuatemalaGuineaGuinea-BissauGuyanaHeavily indebted poor countries (HIPC)High incomeHondurasHong Kong SAR, ChinaHungaryIBRD onlyIcelandIDA & IBRD totalIDA blendIDA onlyIDA totalIndiaIndonesiaIran, Islamic Rep.IraqIrelandIsraelItalyJamaicaJapanJordanKazakhstanKenyaKiribatiKorea, Dem. People’s Rep.Korea, Rep.KuwaitKyrgyz RepublicLao PDRLate-demographic dividendLatin America & Caribbean Latin America & Caribbean (excluding high income)Latin America & the Caribbean (IDA & IBRD countries)LatviaLeast developed countries: UN classificationLebanonLesothoLibyaLiechtensteinLithuaniaLow & middle incomeLow incomeLower middle incomeLuxembourgMacao SAR, ChinaMacedonia, FYRMadagascarMalawiMalaysiaMaldivesMaliMaltaMarshall IslandsMauritaniaMauritiusMexicoMiddle East & North AfricaMiddle East & North Africa (excluding high income)Middle East & North Africa (IDA & IBRD countries)Middle incomeMoldovaMongoliaMoroccoMozambiqueMyanmarNamibiaNauruNepalNetherlandsNew ZealandNicaraguaNigerNorth AmericaNorwayOECD membersOmanOther small statesPacific island small statesPakistanPanamaParaguayPeruPhilippinesPolandPortugalPost-demographic dividendPre-demographic dividendPuerto RicoQatarRomaniaSamoaSao Tome and PrincipeSaudi ArabiaSenegalSerbiaSeychellesSierra LeoneSloveniaSmall statesSolomon IslandsSomaliaSouth AfricaSouth AsiaSouth Asia (IDA & IBRD)SpainSri LankaSt. Kitts and NevisSt. LuciaSt. Vincent and the GrenadinesSub-Saharan Africa Sub-Saharan Africa (excluding high income)Sub-Saharan Africa (IDA & IBRD countries)SurinameSwazilandSwedenSwitzerlandSyrian Arab RepublicTajikistanThailandTimor-LesteTogoTongaTrinidad and TobagoTunisiaTurkeyTuvaluUgandaUkraineUnited Arab EmiratesUnited KingdomUnited StatesUpper middle incomeUruguayVanuatuVenezuela, RBVietnamWest Bank and GazaWorldYemen, Rep.Zimbabwe

Linha do tempo:

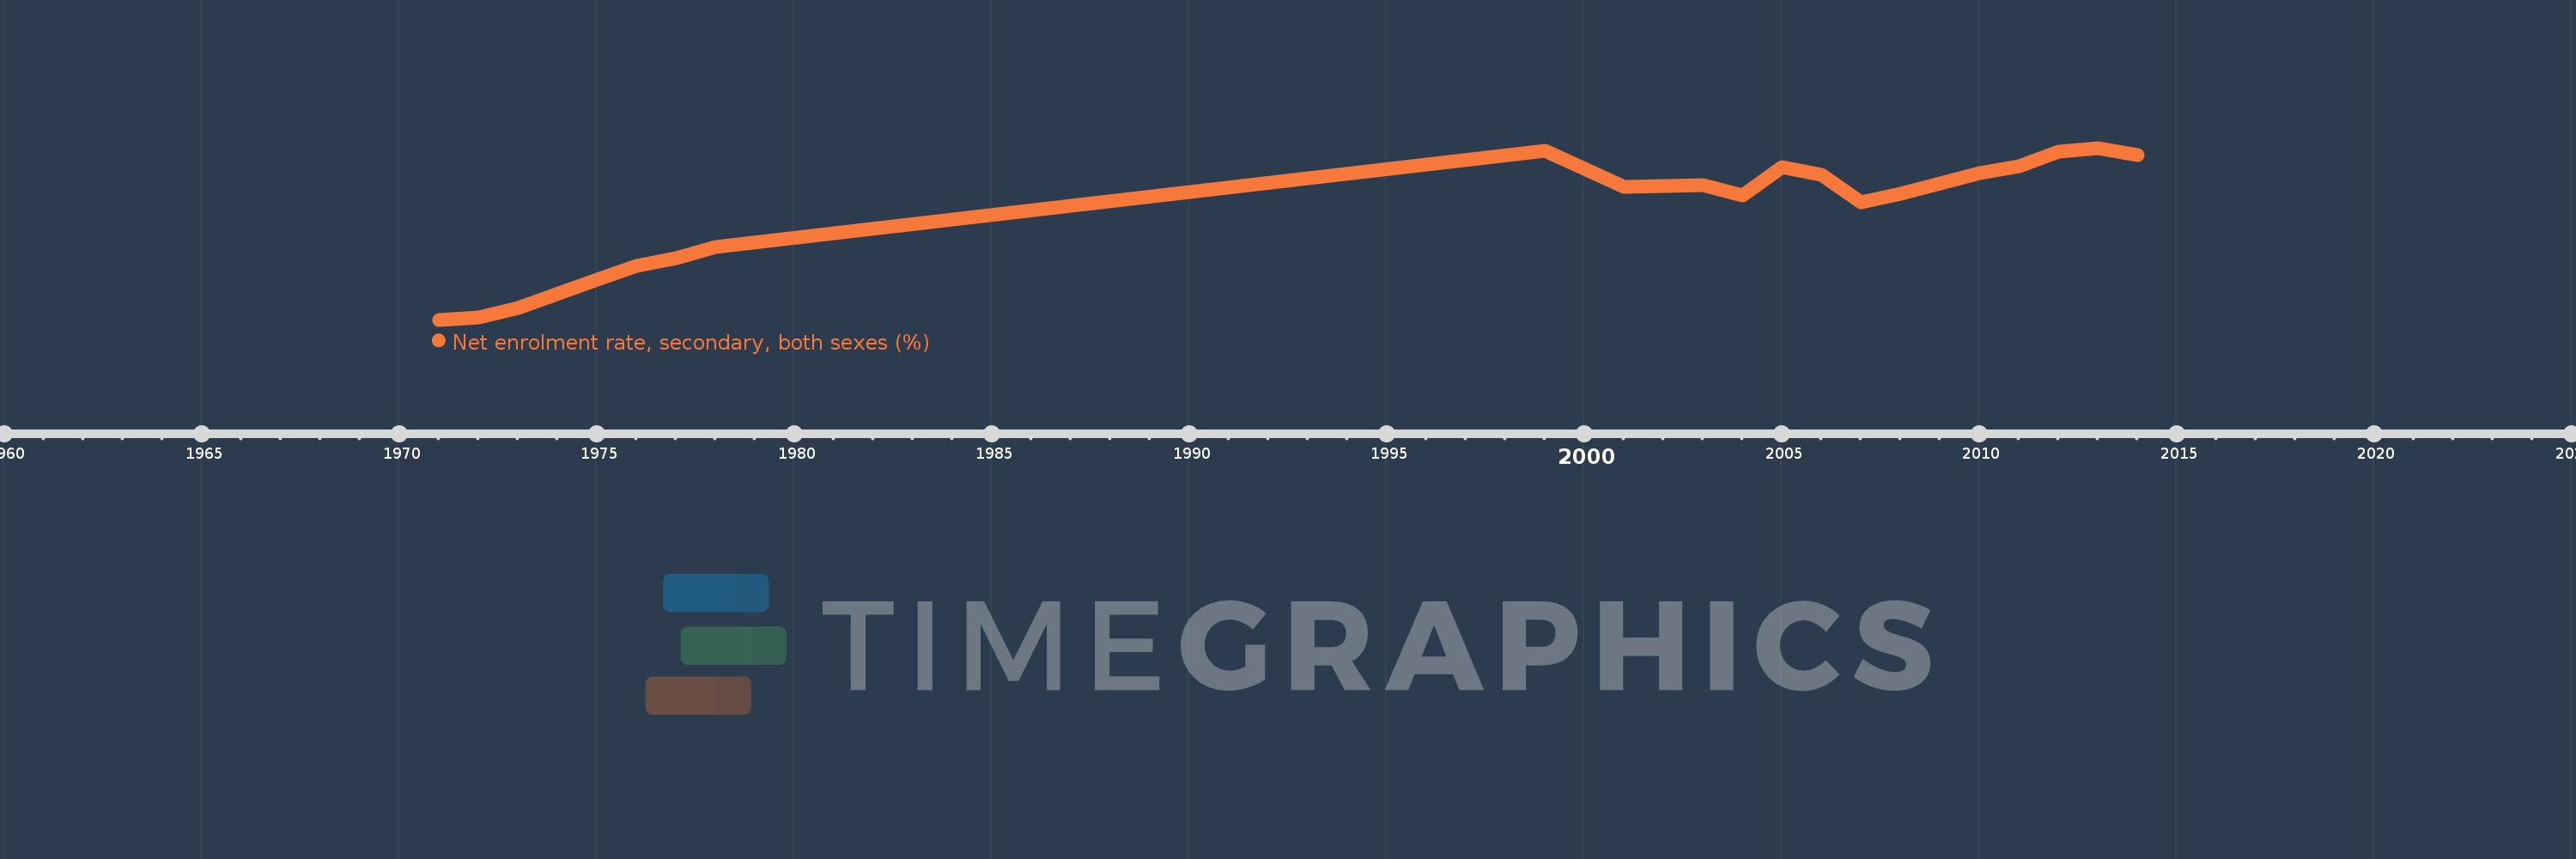
Nesta escala de tempo está apresentado um gráfico de 1971 ano até 2014 ano Swaziland. Dados de 1970 ano ausente. O número de observações reais por data: 22.

Fonte (nome):

Indicadores de desenvolvimento mundial

Fonte (organização):

UNESCO Institute for Statistics

Categorias:

Education

Foi atualizado:

23 abr 2017 ano

Indicadores de alterações dos valores ao longo dos anos

Em média:
26.692
Mínimo:
10.905
1 jan 1971 ano
Máximo:
35.42
1 jan 2013 ano
Na data de observação
Valor
Mudança absoluta
A alteração em relação ao valor anterior
1 jan 1971 ano
10.905
+10.905
0.0%
1 jan 1972 ano
11.22
+0.315
2.89%
1 jan 1973 ano
12.607
+1.387
12.36%
1 jan 1975 ano
16.677
+4.07
32.28%
1 jan 1976 ano
18.544
+1.867
11.19%
1 jan 1977 ano
19.663
+1.119
6.04%
1 jan 1978 ano
21.245
+1.582
8.05%
1 jan 1999 ano
35.032
+13.786
64.89%
1 jan 2000 ano
32.462
-2.57
-7.34%
1 jan 2001 ano
29.811
-2.651
-8.17%
1 jan 2002 ano
29.938
+0.127
0.43%
1 jan 2003 ano
30.16
+0.223
0.74%
1 jan 2004 ano
28.67
-1.49
-4.94%
1 jan 2005 ano
32.642
+3.972
13.86%
1 jan 2006 ano
31.539
-1.103
-3.38%
1 jan 2007 ano
27.702
-3.837
-12.17%
1 jan 2008 ano
28.932
+1.231
4.44%
1 jan 2010 ano
31.866
+2.934
10.14%
1 jan 2011 ano
32.817
+0.951
2.98%
1 jan 2012 ano
34.919
+2.101
6.4%
1 jan 2013 ano
35.42
+0.501
1.44%
1 jan 2014 ano
34.448
-0.972
-2.74%

Classificação de países por estatísticas atuais por anos