33
/pt/
AIzaSyAYiBZKx7MnpbEhh9jyipgxe19OcubqV5w
August 1, 2025
212059
Niger
NER
true
2
1
Net enrolment rate, secondary, both sexes (%)
2015,2012,2011,2010,2009,2008,2006,2005,2004,2003,2002,2000,1998,1992,1991,1982,1980,1979,1978,1977,1975
Download
Biblioteca de estatísticas globais →Niger →

Net enrolment rate, secondary, both sexes (%)

Estas estatísticas em outros países:

AfghanistanAlbaniaAlgeriaAngolaAntigua and BarbudaArab WorldArgentinaArmeniaArubaAustraliaAustriaAzerbaijanBahamas, TheBahrainBangladeshBarbadosBelarusBelgiumBelizeBeninBermudaBhutanBoliviaBotswanaBrazilBritish Virgin IslandsBrunei DarussalamBulgariaBurkina FasoBurundiCabo VerdeCambodiaCameroonCanadaCaribbean small statesCentral African RepublicCentral Europe and the BalticsChadChileColombiaComorosCongo, Dem. Rep.Congo, Rep.Costa RicaCroatiaCubaCyprusDenmarkDjiboutiDominicaDominican RepublicEarly-demographic dividendEast Asia & PacificEast Asia & Pacific (excluding high income)East Asia & Pacific (IDA & IBRD countries)EcuadorEgypt, Arab Rep.El SalvadorEquatorial GuineaEritreaEstoniaEthiopiaEuro areaEurope & Central AsiaEurope & Central Asia (excluding high income)Europe & Central Asia (IDA & IBRD countries)European UnionFijiFinlandFragile and conflict affected situationsFranceGambia, TheGeorgiaGhanaGreeceGrenadaGuatemalaGuineaGuinea-BissauGuyanaHeavily indebted poor countries (HIPC)High incomeHondurasHong Kong SAR, ChinaHungaryIBRD onlyIcelandIDA & IBRD totalIDA blendIDA onlyIDA totalIndiaIndonesiaIran, Islamic Rep.IraqIrelandIsraelItalyJamaicaJapanJordanKazakhstanKenyaKiribatiKorea, Dem. People’s Rep.Korea, Rep.KuwaitKyrgyz RepublicLao PDRLate-demographic dividendLatin America & Caribbean Latin America & Caribbean (excluding high income)Latin America & the Caribbean (IDA & IBRD countries)LatviaLeast developed countries: UN classificationLebanonLesothoLibyaLiechtensteinLithuaniaLow & middle incomeLow incomeLower middle incomeLuxembourgMacao SAR, ChinaMacedonia, FYRMadagascarMalawiMalaysiaMaldivesMaliMaltaMarshall IslandsMauritaniaMauritiusMexicoMiddle East & North AfricaMiddle East & North Africa (excluding high income)Middle East & North Africa (IDA & IBRD countries)Middle incomeMoldovaMongoliaMoroccoMozambiqueMyanmarNamibiaNauruNepalNetherlandsNew ZealandNicaraguaNigerNorth AmericaNorwayOECD membersOmanOther small statesPacific island small statesPakistanPanamaParaguayPeruPhilippinesPolandPortugalPost-demographic dividendPre-demographic dividendPuerto RicoQatarRomaniaSamoaSao Tome and PrincipeSaudi ArabiaSenegalSerbiaSeychellesSierra LeoneSloveniaSmall statesSolomon IslandsSomaliaSouth AfricaSouth AsiaSouth Asia (IDA & IBRD)SpainSri LankaSt. Kitts and NevisSt. LuciaSt. Vincent and the GrenadinesSub-Saharan Africa Sub-Saharan Africa (excluding high income)Sub-Saharan Africa (IDA & IBRD countries)SurinameSwazilandSwedenSwitzerlandSyrian Arab RepublicTajikistanThailandTimor-LesteTogoTongaTrinidad and TobagoTunisiaTurkeyTuvaluUgandaUkraineUnited Arab EmiratesUnited KingdomUnited StatesUpper middle incomeUruguayVanuatuVenezuela, RBVietnamWest Bank and GazaWorldYemen, Rep.Zimbabwe

Linha do tempo:

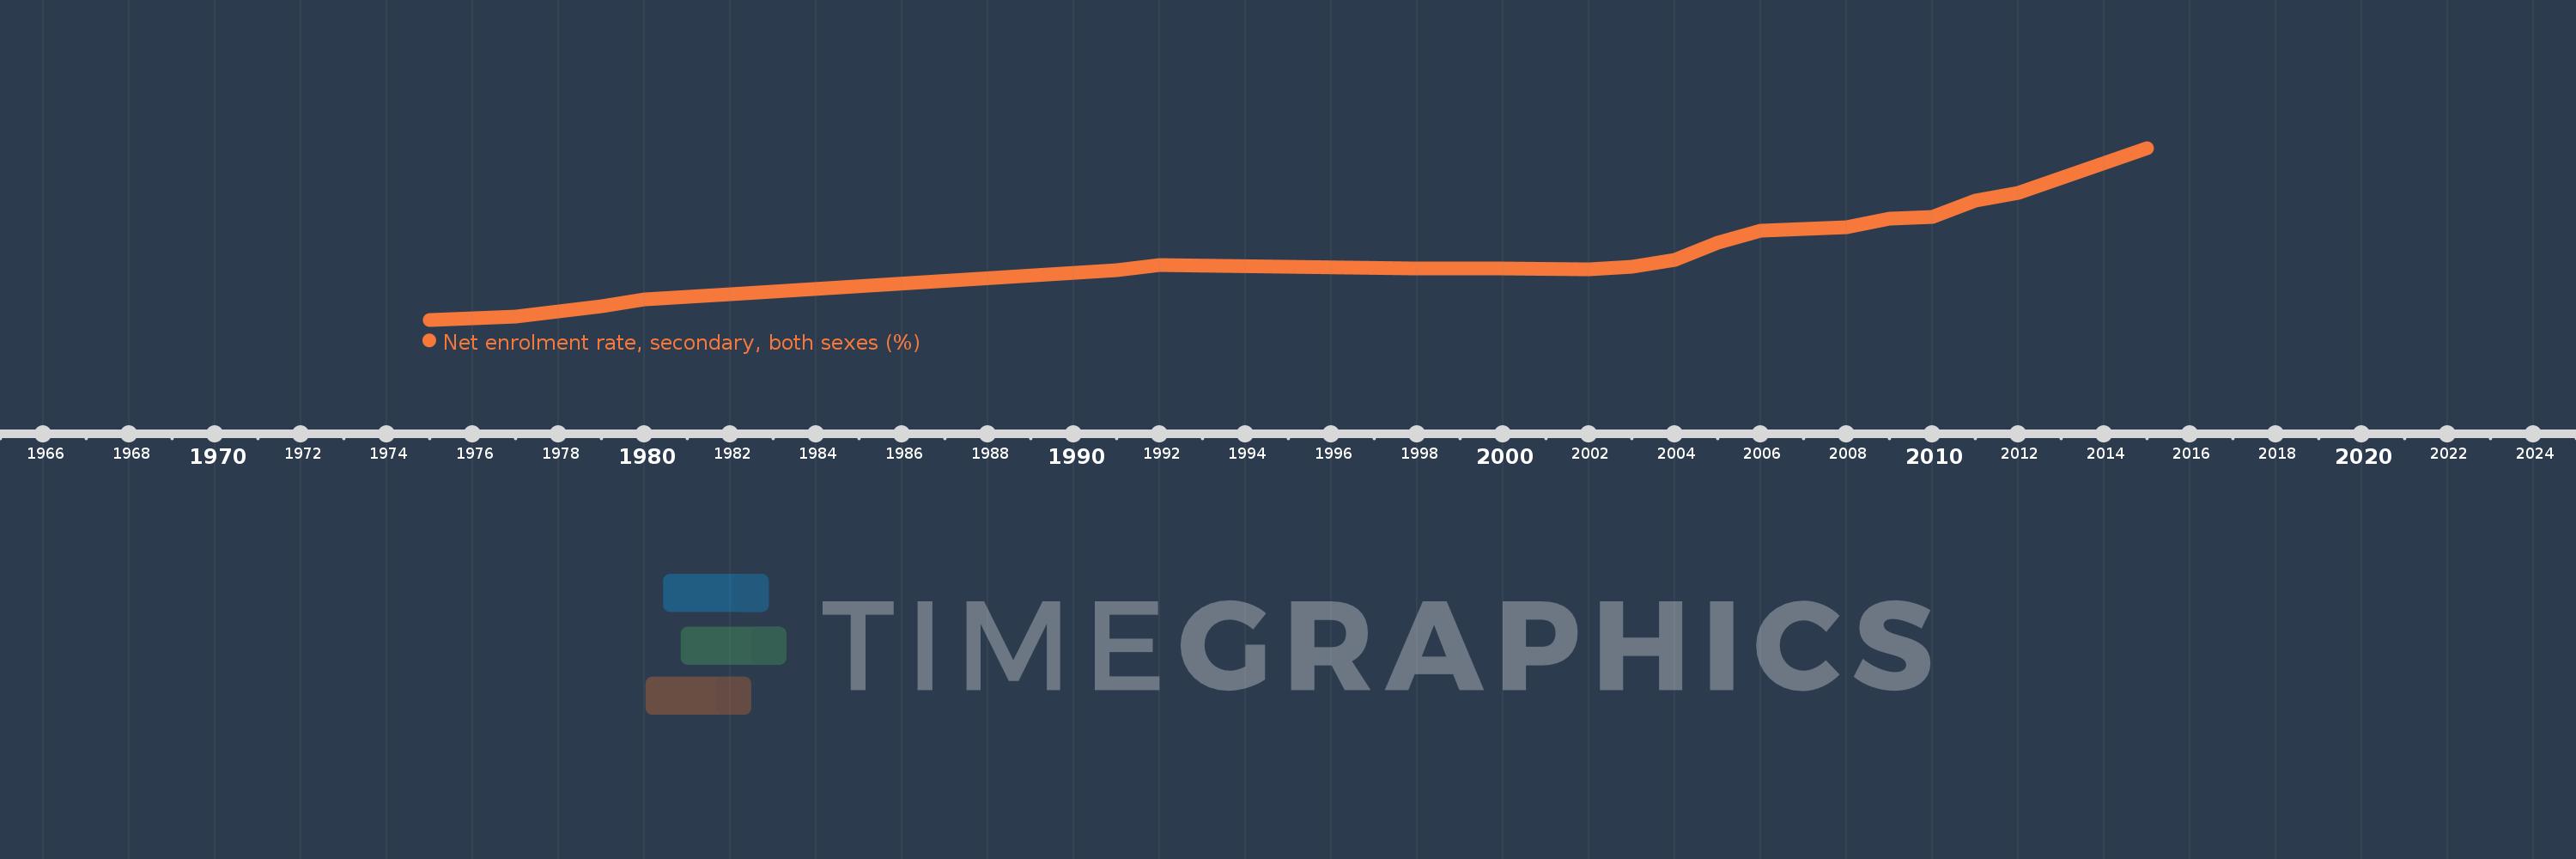
Nesta escala de tempo está apresentado um gráfico de 1975 ano até 2015 ano Niger. Dados de 1974 ano ausente. O número de observações reais por data: 21.

Fonte (nome):

Indicadores de desenvolvimento mundial

Fonte (organização):

UNESCO Institute for Statistics

Categorias:

Education

Foi atualizado:

23 abr 2017 ano

Indicadores de alterações dos valores ao longo dos anos

Em média:
6.617
Mínimo:
1.392
1 jan 1975 ano
Máximo:
15.665
1 jan 2015 ano
Na data de observação
Valor
Mudança absoluta
A alteração em relação ao valor anterior
1 jan 1975 ano
1.392
+1.392
0.0%
1 jan 1977 ano
1.68
+0.288
20.67%
1 jan 1978 ano
2.105
+0.425
25.3%
1 jan 1979 ano
2.527
+0.422
20.04%
1 jan 1980 ano
3.062
+0.535
21.19%
1 jan 1982 ano
3.521
+0.459
14.99%
1 jan 1991 ano
5.5
+1.979
56.2%
1 jan 1992 ano
5.925
+0.424
7.72%
1 jan 1998 ano
5.633
-0.292
-4.93%
1 jan 2000 ano
5.654
+0.022
0.39%
1 jan 2002 ano
5.565
-0.089
-1.58%
1 jan 2003 ano
5.772
+0.207
3.72%
1 jan 2004 ano
6.394
+0.622
10.78%
1 jan 2005 ano
7.774
+1.381
21.6%
1 jan 2006 ano
8.772
+0.998
12.83%
1 jan 2008 ano
9.113
+0.34
3.88%
1 jan 2009 ano
9.779
+0.666
7.31%
1 jan 2010 ano
9.942
+0.163
1.67%
1 jan 2011 ano
11.264
+1.322
13.3%
1 jan 2012 ano
11.924
+0.659
5.85%
1 jan 2015 ano
15.665
+3.741
31.38%

Classificação de países por estatísticas atuais por anos