33
/pt/
AIzaSyB4mHJ5NPEv-XzF7P6NDYXjlkCWaeKw5bc
November 1, 2025
182374
Luxembourg
LUX
true
2
1
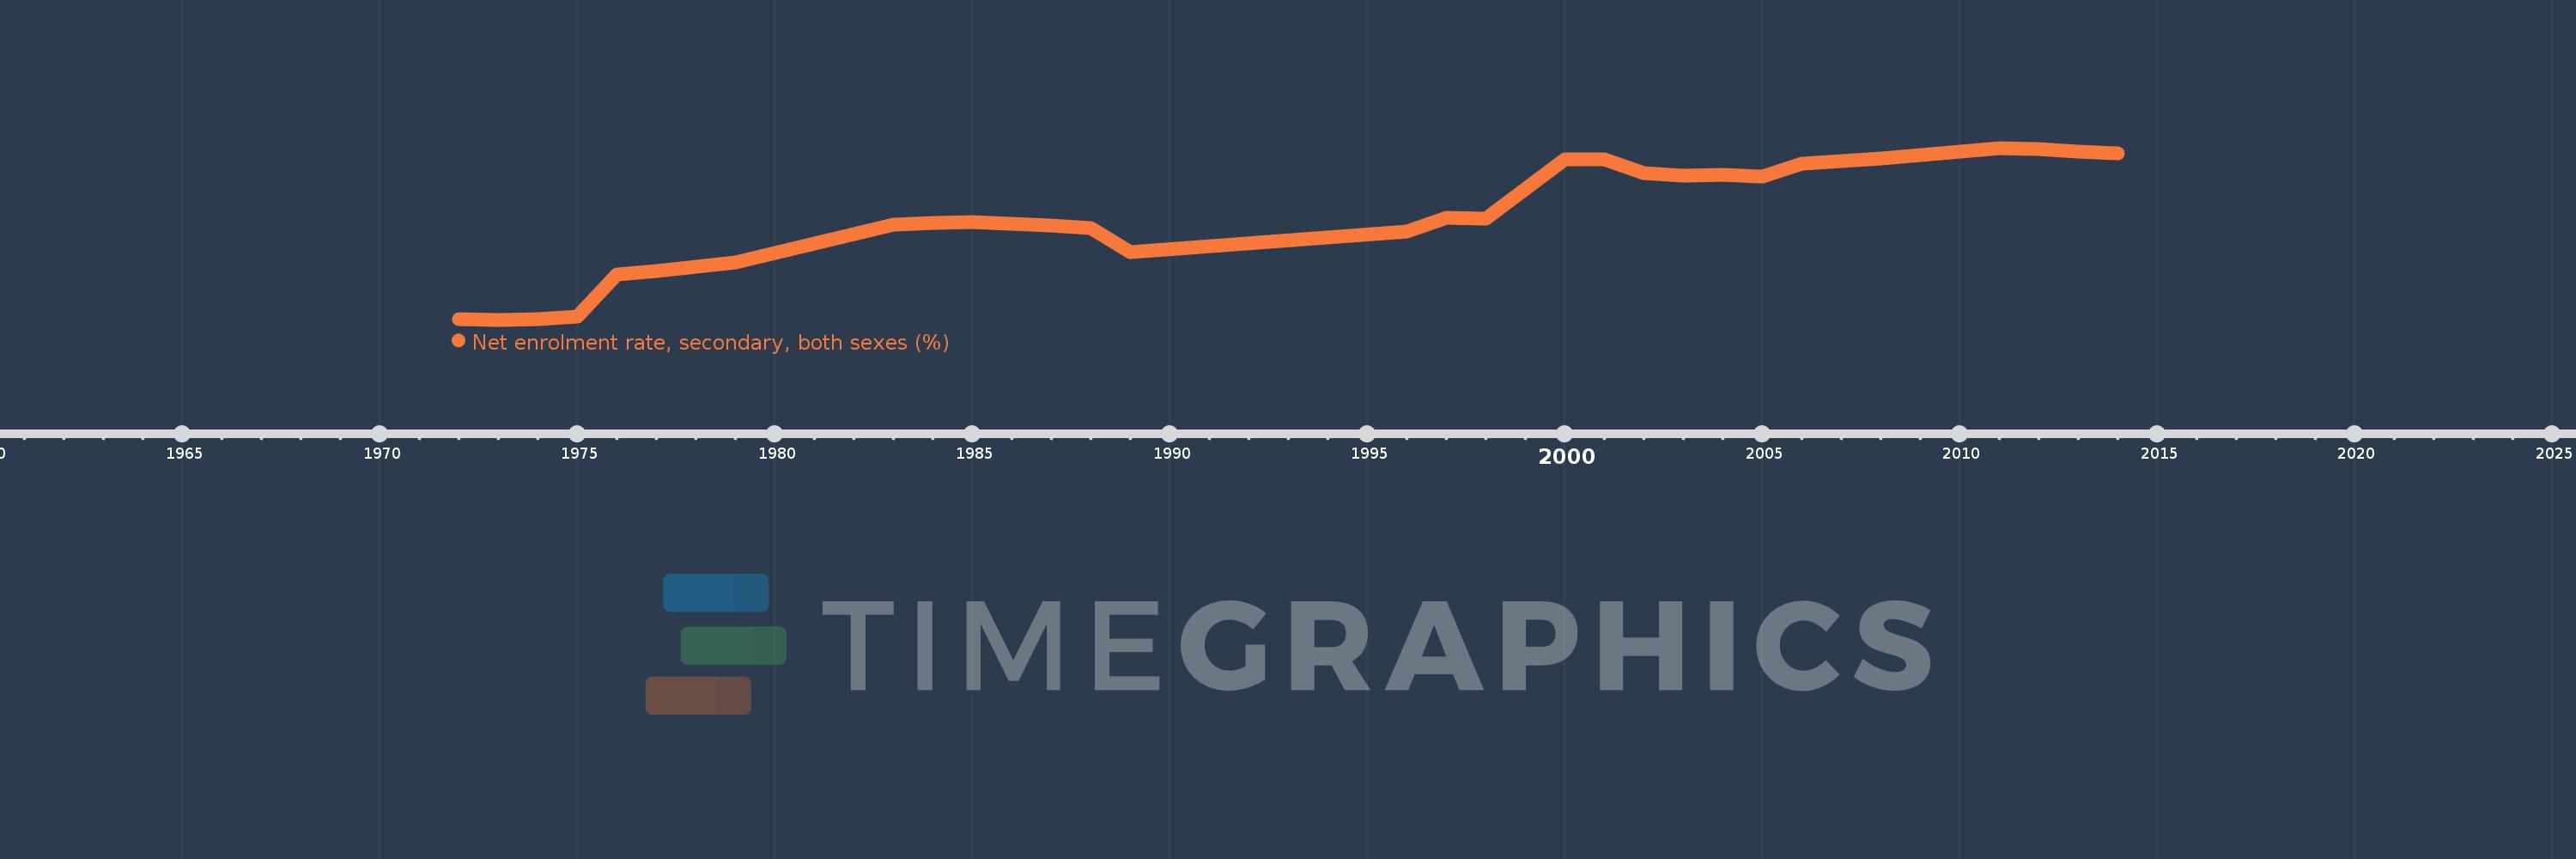
Net enrolment rate, secondary, both sexes (%)
2014,2013,2012,2011,2009,2008,2007,2006,2005,2004,2003,2002,2001,2000,1998,1997,1996,1989,1988,1987,1985,1984,1983,1979,1978,1977,1976,1975,1974,1973,1972