29
/pt/
pt
AIzaSyAYiBZKx7MnpbEhh9jyipgxe19OcubqV5w
April 1, 2024
236242
Senegal
SEN
true
2
1
Percentage of teachers in primary education who are trained, both sexes (%)
2015,2013,2011,2010,2009,2008,2007,2006,2005,2004
Download
Biblioteca de estatísticas globais →Senegal →

Percentage of teachers in primary education who are trained, both sexes (%)

Estas estatísticas em outros países:
AlgeriaAndorraAngolaAntigua and BarbudaArab WorldArmeniaArubaAzerbaijanBahamas, TheBahrainBangladeshBarbadosBelarusBelizeBeninBermudaBhutanBoliviaBotswanaBritish Virgin IslandsBrunei DarussalamBurkina FasoBurundiCabo VerdeCambodiaCameroonCaribbean small statesCayman IslandsCentral African RepublicChadColombiaComorosCongo, Dem. Rep.Congo, Rep.Costa RicaCote d'IvoireCroatiaCubaDjiboutiDominicaDominican RepublicEarly-demographic dividendEcuadorEgypt, Arab Rep.El SalvadorEquatorial GuineaEritreaEthiopiaEurope & Central Asia (excluding high income)FijiFragile and conflict affected situationsGabonGambia, TheGeorgiaGhanaGibraltarGrenadaGuineaGuinea-BissauGuyanaHeavily indebted poor countries (HIPC)HondurasHong Kong SAR, ChinaIDA blendIDA onlyIDA totalIran, Islamic Rep.IraqJamaicaKazakhstanKenyaKiribatiKuwaitKyrgyz RepublicLao PDRLatin America & Caribbean Latin America & Caribbean (excluding high income)Latin America & the Caribbean (IDA & IBRD countries)Least developed countries: UN classificationLebanonLesothoLiberiaLow incomeLower middle incomeMacao SAR, ChinaMadagascarMalawiMalaysiaMaldivesMaliMauritaniaMauritiusMexicoMiddle East & North AfricaMiddle East & North Africa (excluding high income)Middle East & North Africa (IDA & IBRD countries)MoldovaMongoliaMoroccoMozambiqueMyanmarNamibiaNauruNepalNicaraguaNigerNigeriaOmanOther small statesPacific island small statesPakistanPanamaParaguayPhilippinesPre-demographic dividendQatarRwandaSao Tome and PrincipeSaudi ArabiaSenegalSerbiaSeychellesSierra LeoneSingaporeSmall statesSolomon IslandsSouth AfricaSouth SudanSri LankaSt. Kitts and NevisSt. LuciaSt. Vincent and the GrenadinesSub-Saharan Africa Sub-Saharan Africa (excluding high income)Sub-Saharan Africa (IDA & IBRD countries)SurinameSwazilandSyrian Arab RepublicTajikistanTanzaniaThailandTogoTongaTrinidad and TobagoTunisiaTurks and Caicos IslandsUgandaUkraineUnited Arab EmiratesUzbekistanVanuatuVietnamWest Bank and GazaZambiaZimbabwe
Linha do tempo:
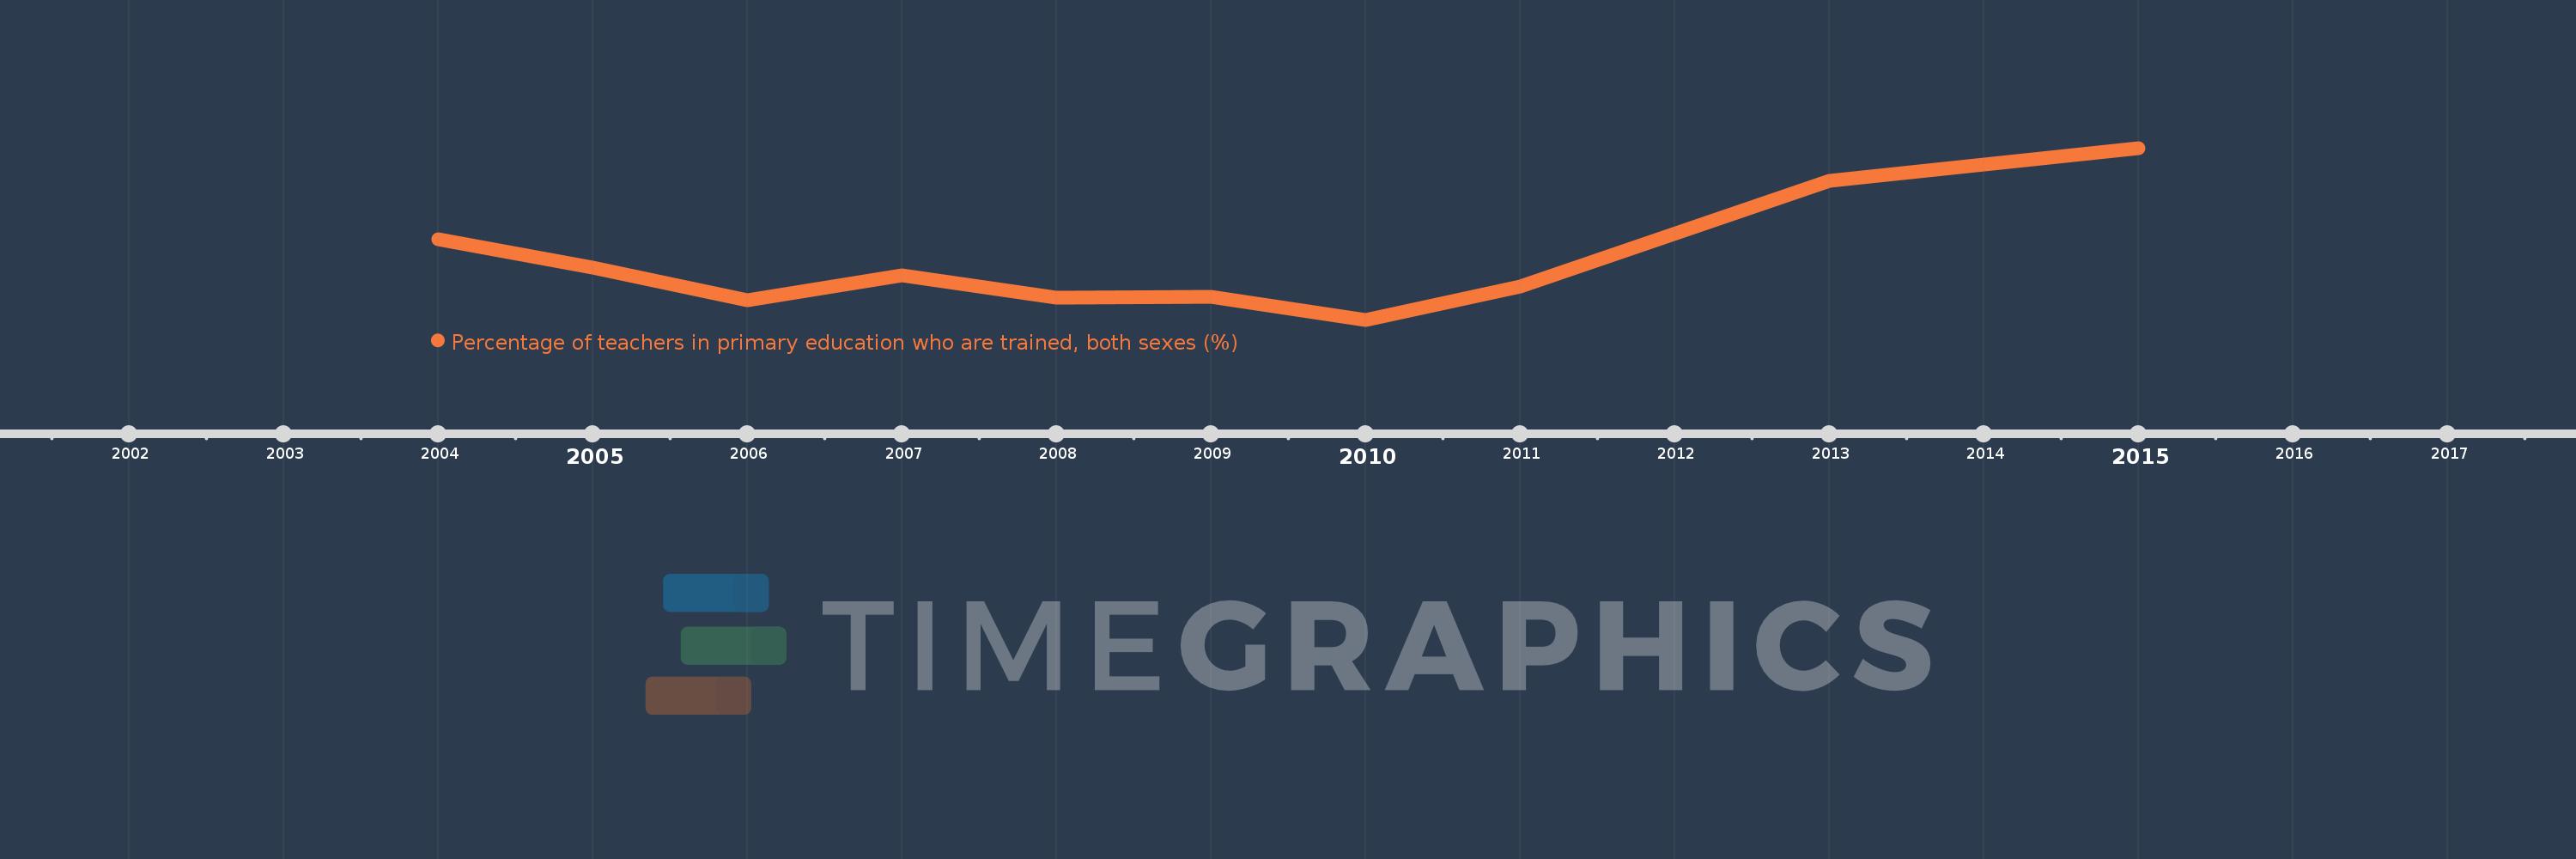
Nesta escala de tempo está apresentado um gráfico de 2004 ano até 2015 ano Senegal. Dados de 2003 ano ausente. O número de observações reais por data: 10.
Fonte (nome):
Indicadores de desenvolvimento mundial
Fonte (organização):
United Nations Educational, Scientific, and Cultural Organization (UNESCO) Institute for Statistics.
Categorias:
Education
Foi atualizado:
23 abr 2017 ano
Indicadores de alterações dos valores ao longo dos anos
Em média:
51.894
Mínimo:
42.561
1 jan 2010 ano
Máximo:
69.968
1 jan 2015 ano
Na data de observação
Valor
Mudança absoluta
A alteração em relação ao valor anterior
1 jan 2004 ano
55.379
+55.379
0.0%
1 jan 2005 ano
50.842
-4.537
-8.19%
1 jan 2006 ano
45.698
-5.144
-10.12%
1 jan 2007 ano
49.695
+3.998
8.75%
1 jan 2008 ano
46.039
-3.657
-7.36%
1 jan 2009 ano
46.184
+0.145
0.32%
1 jan 2010 ano
42.561
-3.623
-7.85%
1 jan 2011 ano
47.853
+5.292
12.43%
1 jan 2013 ano
64.722
+16.869
35.25%
1 jan 2015 ano
69.968
+5.246
8.11%
Classificação de países por estatísticas atuais por anos

Comentários:

Enviar
PremiumAbout & FeedbackAcordoPrivacidade
logo
© 2022 Selected Technologies LLC – Morgan Hill, California