29
/pt/
pt
AIzaSyAYiBZKx7MnpbEhh9jyipgxe19OcubqV5w
April 1, 2024
143370
Grenada
GRD
true
2
1
Percentage of teachers in primary education who are trained, both sexes (%)
2015,2014,2011,2010,2009,2008,2006,2004,2002,2001
Download
Biblioteca de estatísticas globais →Grenada →

Percentage of teachers in primary education who are trained, both sexes (%)

Estas estatísticas em outros países:
AlgeriaAndorraAngolaAntigua and BarbudaArab WorldArmeniaArubaAzerbaijanBahamas, TheBahrainBangladeshBarbadosBelarusBelizeBeninBermudaBhutanBoliviaBotswanaBritish Virgin IslandsBrunei DarussalamBurkina FasoBurundiCabo VerdeCambodiaCameroonCaribbean small statesCayman IslandsCentral African RepublicChadColombiaComorosCongo, Dem. Rep.Congo, Rep.Costa RicaCote d'IvoireCroatiaCubaDjiboutiDominicaDominican RepublicEarly-demographic dividendEcuadorEgypt, Arab Rep.El SalvadorEquatorial GuineaEritreaEthiopiaEurope & Central Asia (excluding high income)FijiFragile and conflict affected situationsGabonGambia, TheGeorgiaGhanaGibraltarGrenadaGuineaGuinea-BissauGuyanaHeavily indebted poor countries (HIPC)HondurasHong Kong SAR, ChinaIDA blendIDA onlyIDA totalIran, Islamic Rep.IraqJamaicaKazakhstanKenyaKiribatiKuwaitKyrgyz RepublicLao PDRLatin America & Caribbean Latin America & Caribbean (excluding high income)Latin America & the Caribbean (IDA & IBRD countries)Least developed countries: UN classificationLebanonLesothoLiberiaLow incomeLower middle incomeMacao SAR, ChinaMadagascarMalawiMalaysiaMaldivesMaliMauritaniaMauritiusMexicoMiddle East & North AfricaMiddle East & North Africa (excluding high income)Middle East & North Africa (IDA & IBRD countries)MoldovaMongoliaMoroccoMozambiqueMyanmarNamibiaNauruNepalNicaraguaNigerNigeriaOmanOther small statesPacific island small statesPakistanPanamaParaguayPhilippinesPre-demographic dividendQatarRwandaSao Tome and PrincipeSaudi ArabiaSenegalSerbiaSeychellesSierra LeoneSingaporeSmall statesSolomon IslandsSouth AfricaSouth SudanSri LankaSt. Kitts and NevisSt. LuciaSt. Vincent and the GrenadinesSub-Saharan Africa Sub-Saharan Africa (excluding high income)Sub-Saharan Africa (IDA & IBRD countries)SurinameSwazilandSyrian Arab RepublicTajikistanTanzaniaThailandTogoTongaTrinidad and TobagoTunisiaTurks and Caicos IslandsUgandaUkraineUnited Arab EmiratesUzbekistanVanuatuVietnamWest Bank and GazaZambiaZimbabwe
Linha do tempo:
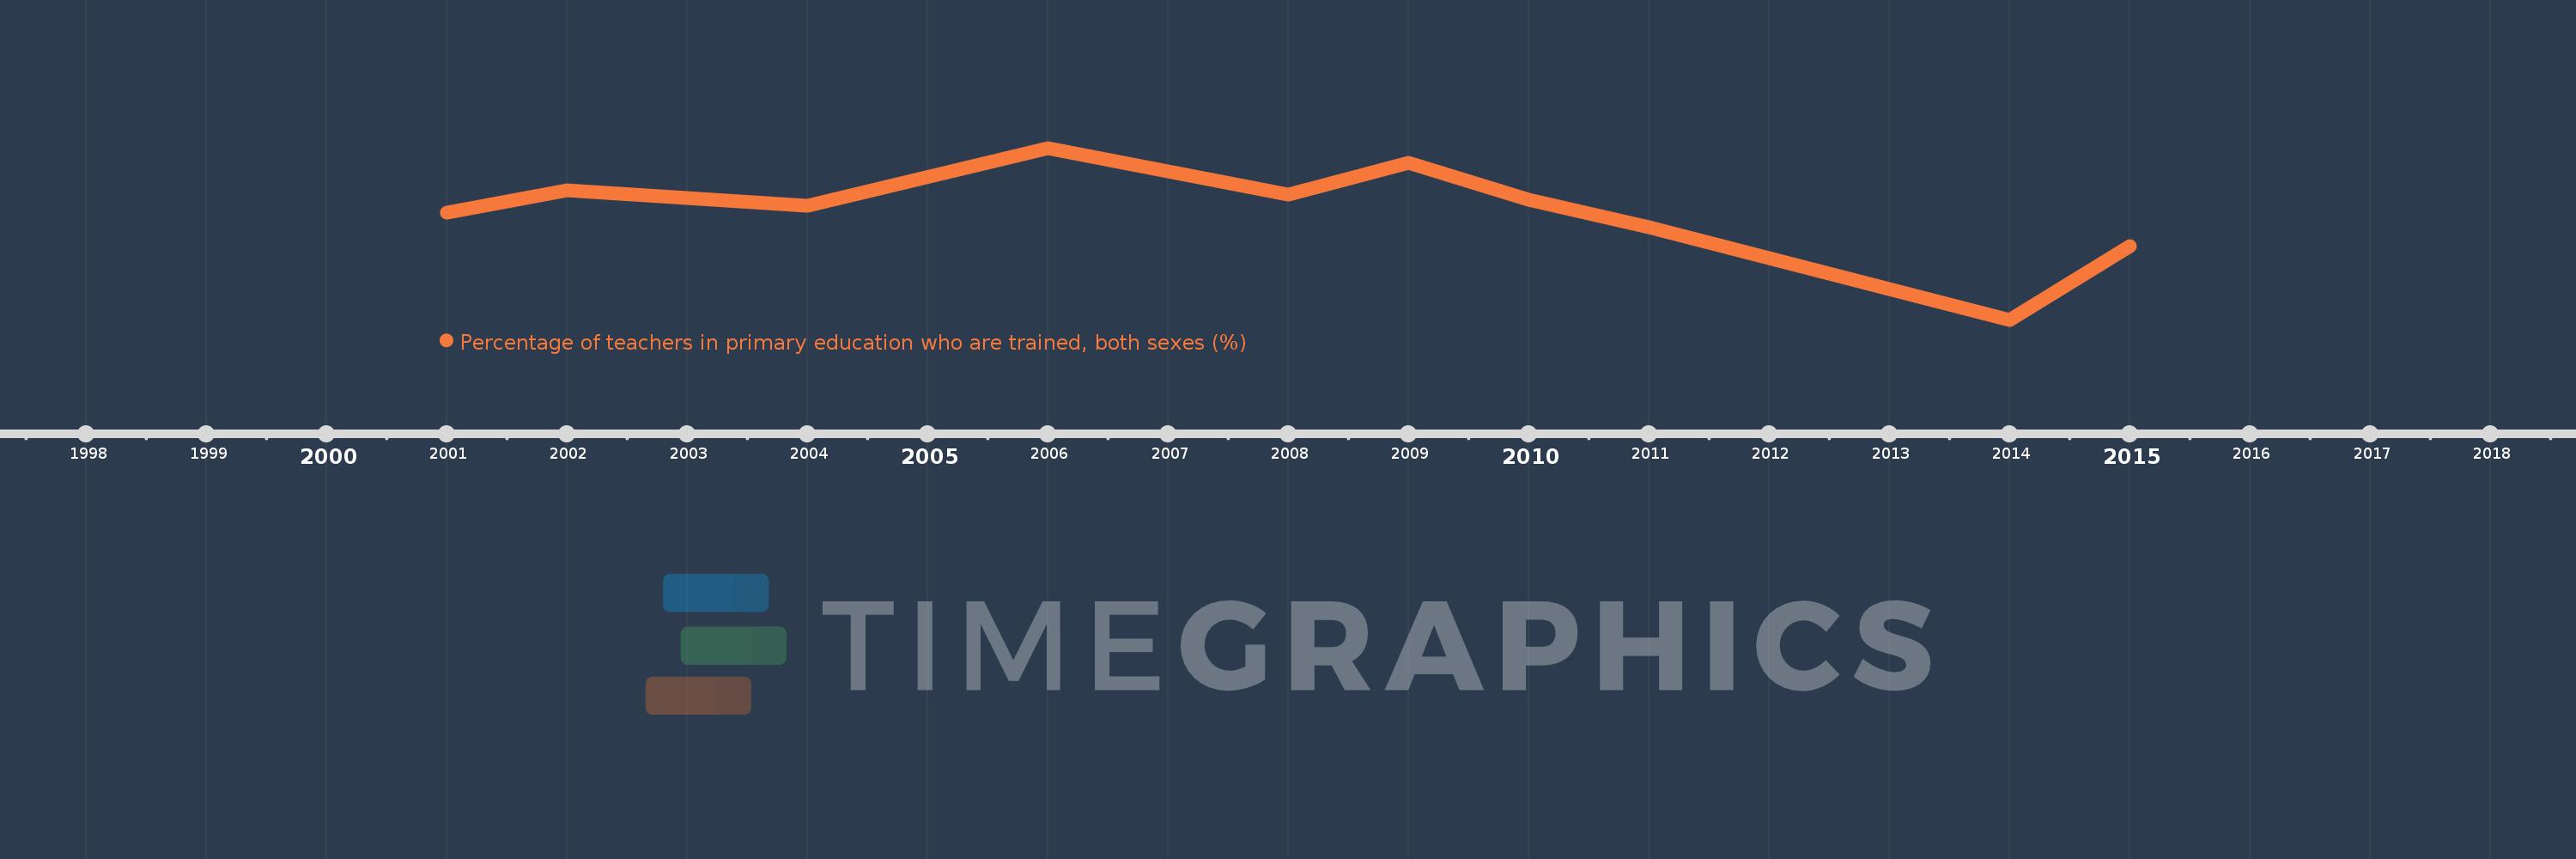
Nesta escala de tempo está apresentado um gráfico de 2001 ano até 2015 ano Grenada. Dados de 2000 ano ausente. O número de observações reais por data: 10.
Fonte (nome):
Indicadores de desenvolvimento mundial
Fonte (organização):
United Nations Educational, Scientific, and Cultural Organization (UNESCO) Institute for Statistics.
Categorias:
Education
Foi atualizado:
23 abr 2017 ano
Indicadores de alterações dos valores ao longo dos anos
Em média:
67.441
Mínimo:
53.714
1 jan 2014 ano
Máximo:
75.348
1 jan 2006 ano
Na data de observação
Valor
Mudança absoluta
A alteração em relação ao valor anterior
1 jan 2001 ano
67.211
+67.211
0.0%
1 jan 2002 ano
70.065
+2.854
4.25%
1 jan 2004 ano
68.018
-2.047
-2.92%
1 jan 2006 ano
75.348
+7.33
10.78%
1 jan 2008 ano
69.46
-5.887
-7.81%
1 jan 2009 ano
73.496
+4.036
5.81%
1 jan 2010 ano
68.795
-4.701
-6.4%
1 jan 2011 ano
65.335
-3.46
-5.03%
1 jan 2014 ano
53.714
-11.621
-17.79%
1 jan 2015 ano
62.971
+9.257
17.23%
Classificação de países por estatísticas atuais por anos

Comentários:

Enviar
PremiumAbout & FeedbackAcordoPrivacidade
logo
© 2022 Selected Technologies LLC – Morgan Hill, California