29
/pt/
pt
AIzaSyAYiBZKx7MnpbEhh9jyipgxe19OcubqV5w
April 1, 2024
189416
Maldives
MDV
true
2
1
Percentage of teachers in primary education who are trained, both sexes (%)
2015,2014,2013,2012,2011,2010,2009,2008,2007,2006,2004,2003,2002,2001,2000,1999
Download
Biblioteca de estatísticas globais →Maldives →

Percentage of teachers in primary education who are trained, both sexes (%)

Estas estatísticas em outros países:
AlgeriaAndorraAngolaAntigua and BarbudaArab WorldArmeniaArubaAzerbaijanBahamas, TheBahrainBangladeshBarbadosBelarusBelizeBeninBermudaBhutanBoliviaBotswanaBritish Virgin IslandsBrunei DarussalamBurkina FasoBurundiCabo VerdeCambodiaCameroonCaribbean small statesCayman IslandsCentral African RepublicChadColombiaComorosCongo, Dem. Rep.Congo, Rep.Costa RicaCote d'IvoireCroatiaCubaDjiboutiDominicaDominican RepublicEarly-demographic dividendEcuadorEgypt, Arab Rep.El SalvadorEquatorial GuineaEritreaEthiopiaEurope & Central Asia (excluding high income)FijiFragile and conflict affected situationsGabonGambia, TheGeorgiaGhanaGibraltarGrenadaGuineaGuinea-BissauGuyanaHeavily indebted poor countries (HIPC)HondurasHong Kong SAR, ChinaIDA blendIDA onlyIDA totalIran, Islamic Rep.IraqJamaicaKazakhstanKenyaKiribatiKuwaitKyrgyz RepublicLao PDRLatin America & Caribbean Latin America & Caribbean (excluding high income)Latin America & the Caribbean (IDA & IBRD countries)Least developed countries: UN classificationLebanonLesothoLiberiaLow incomeLower middle incomeMacao SAR, ChinaMadagascarMalawiMalaysiaMaldivesMaliMauritaniaMauritiusMexicoMiddle East & North AfricaMiddle East & North Africa (excluding high income)Middle East & North Africa (IDA & IBRD countries)MoldovaMongoliaMoroccoMozambiqueMyanmarNamibiaNauruNepalNicaraguaNigerNigeriaOmanOther small statesPacific island small statesPakistanPanamaParaguayPhilippinesPre-demographic dividendQatarRwandaSao Tome and PrincipeSaudi ArabiaSenegalSerbiaSeychellesSierra LeoneSingaporeSmall statesSolomon IslandsSouth AfricaSouth SudanSri LankaSt. Kitts and NevisSt. LuciaSt. Vincent and the GrenadinesSub-Saharan Africa Sub-Saharan Africa (excluding high income)Sub-Saharan Africa (IDA & IBRD countries)SurinameSwazilandSyrian Arab RepublicTajikistanTanzaniaThailandTogoTongaTrinidad and TobagoTunisiaTurks and Caicos IslandsUgandaUkraineUnited Arab EmiratesUzbekistanVanuatuVietnamWest Bank and GazaZambiaZimbabwe
Linha do tempo:
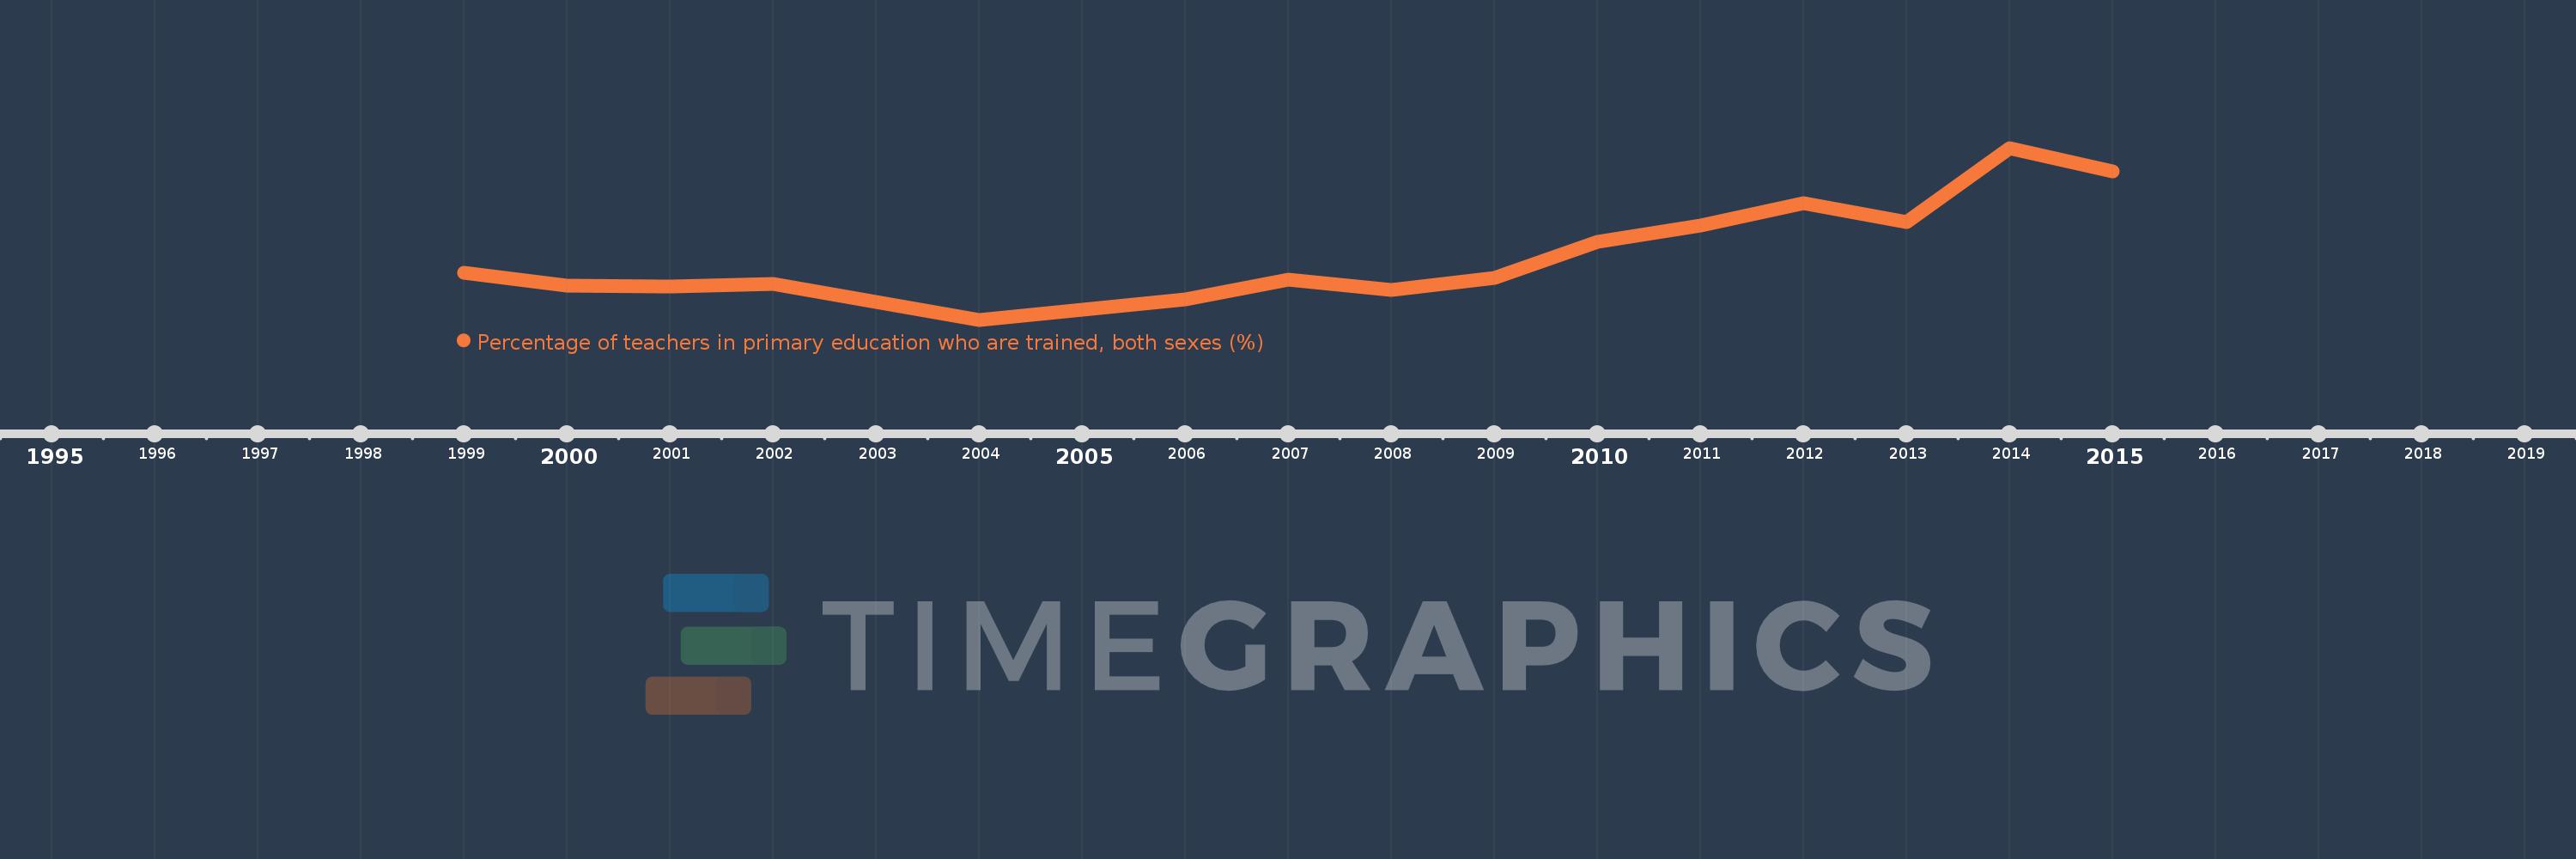
Nesta escala de tempo está apresentado um gráfico de 1999 ano até 2015 ano Maldives. Dados de 1998 ano ausente. O número de observações reais por data: 16.
Fonte (nome):
Indicadores de desenvolvimento mundial
Fonte (organização):
United Nations Educational, Scientific, and Cultural Organization (UNESCO) Institute for Statistics.
Categorias:
Education
Foi atualizado:
23 abr 2017 ano
Indicadores de alterações dos valores ao longo dos anos
Em média:
71.545
Mínimo:
60.812
1 jan 2004 ano
Máximo:
90.12
1 jan 2014 ano
Na data de observação
Valor
Mudança absoluta
A alteração em relação ao valor anterior
1 jan 1999 ano
68.877
+68.877
0.0%
1 jan 2000 ano
66.667
-2.21
-3.21%
1 jan 2001 ano
66.451
-0.216
-0.32%
1 jan 2002 ano
66.941
+0.49
0.74%
1 jan 2003 ano
63.823
-3.118
-4.66%
1 jan 2004 ano
60.812
-3.011
-4.72%
1 jan 2006 ano
64.296
+3.483
5.73%
1 jan 2007 ano
67.596
+3.3
5.13%
1 jan 2008 ano
65.868
-1.728
-2.56%
1 jan 2009 ano
67.925
+2.057
3.12%
1 jan 2010 ano
74.092
+6.167
9.08%
1 jan 2011 ano
76.957
+2.865
3.87%
1 jan 2012 ano
80.763
+3.806
4.95%
1 jan 2013 ano
77.474
-3.289
-4.07%
1 jan 2014 ano
90.12
+12.646
16.32%
1 jan 2015 ano
86.057
-4.063
-4.51%
Classificação de países por estatísticas atuais por anos

Comentários:

Enviar
PremiumAbout & FeedbackAcordoPrivacidade
logo
© 2022 Selected Technologies LLC – Morgan Hill, California