33
/pt/
AIzaSyAYiBZKx7MnpbEhh9jyipgxe19OcubqV5w
August 1, 2025
152054
Hong Kong SAR, China
HKG
true
2
1
Survival rate to Grade 5 of primary education, both sexes (%)
2014,2013,2012,2011,2009,2008,2005,2004,2003,1990,1987,1982,1981
Download
Biblioteca de estatísticas globais →Hong Kong SAR, China →

Survival rate to Grade 5 of primary education, both sexes (%)

Estas estatísticas em outros países:

AfghanistanAlbaniaAlgeriaAndorraAngolaAntigua and BarbudaArab WorldArgentinaArubaBahamas, TheBahrainBangladeshBarbadosBelarusBelgiumBelizeBeninBermudaBhutanBoliviaBosnia and HerzegovinaBotswanaBritish Virgin IslandsBrunei DarussalamBurkina FasoBurundiCabo VerdeCambodiaCameroonCanadaCaribbean small statesCayman IslandsCentral African RepublicChadChileChinaColombiaComorosCongo, Dem. Rep.Congo, Rep.Costa RicaCote d'IvoireCubaCyprusCzech RepublicDenmarkDjiboutiDominicaDominican RepublicEarly-demographic dividendEast Asia & PacificEast Asia & Pacific (excluding high income)East Asia & Pacific (IDA & IBRD countries)EcuadorEgypt, Arab Rep.El SalvadorEquatorial GuineaEritreaEstoniaEthiopiaFijiFinlandFranceGabonGambia, TheGeorgiaGhanaGreeceGrenadaGuatemalaGuineaGuinea-BissauGuyanaHaitiHeavily indebted poor countries (HIPC)HondurasHong Kong SAR, ChinaHungaryIBRD onlyIcelandIDA blendIDA onlyIDA totalIndiaIndonesiaIran, Islamic Rep.IraqIrelandIsraelItalyJamaicaJapanJordanKenyaKiribatiKorea, Rep.KuwaitLao PDRLate-demographic dividendLatviaLeast developed countries: UN classificationLebanonLesothoLiberiaLibyaLiechtensteinLow incomeLower middle incomeLuxembourgMacao SAR, ChinaMadagascarMalawiMalaysiaMaldivesMaliMaltaMarshall IslandsMauritaniaMauritiusMexicoMiddle East & North AfricaMiddle East & North Africa (excluding high income)Middle East & North Africa (IDA & IBRD countries)MonacoMontenegroMoroccoMozambiqueMyanmarNamibiaNepalNetherlandsNicaraguaNigerNigeriaNorwayOmanOther small statesPacific island small statesPakistanPanamaPapua New GuineaParaguayPeruPhilippinesPolandPortugalPre-demographic dividendQatarRwandaSamoaSan MarinoSao Tome and PrincipeSaudi ArabiaSenegalSeychellesSierra LeoneSingaporeSloveniaSolomon IslandsSouth AfricaSouth AsiaSouth Asia (IDA & IBRD)SpainSri LankaSt. Kitts and NevisSt. LuciaSt. Vincent and the GrenadinesSub-Saharan Africa Sub-Saharan Africa (excluding high income)Sub-Saharan Africa (IDA & IBRD countries)SudanSurinameSwazilandSwedenSwitzerlandSyrian Arab RepublicTanzaniaThailandTimor-LesteTogoTongaTrinidad and TobagoTunisiaTurkeyTuvaluUgandaUnited Arab EmiratesUpper middle incomeUruguayVanuatuVenezuela, RBVietnamYemen, Rep.ZambiaZimbabwe

Linha do tempo:

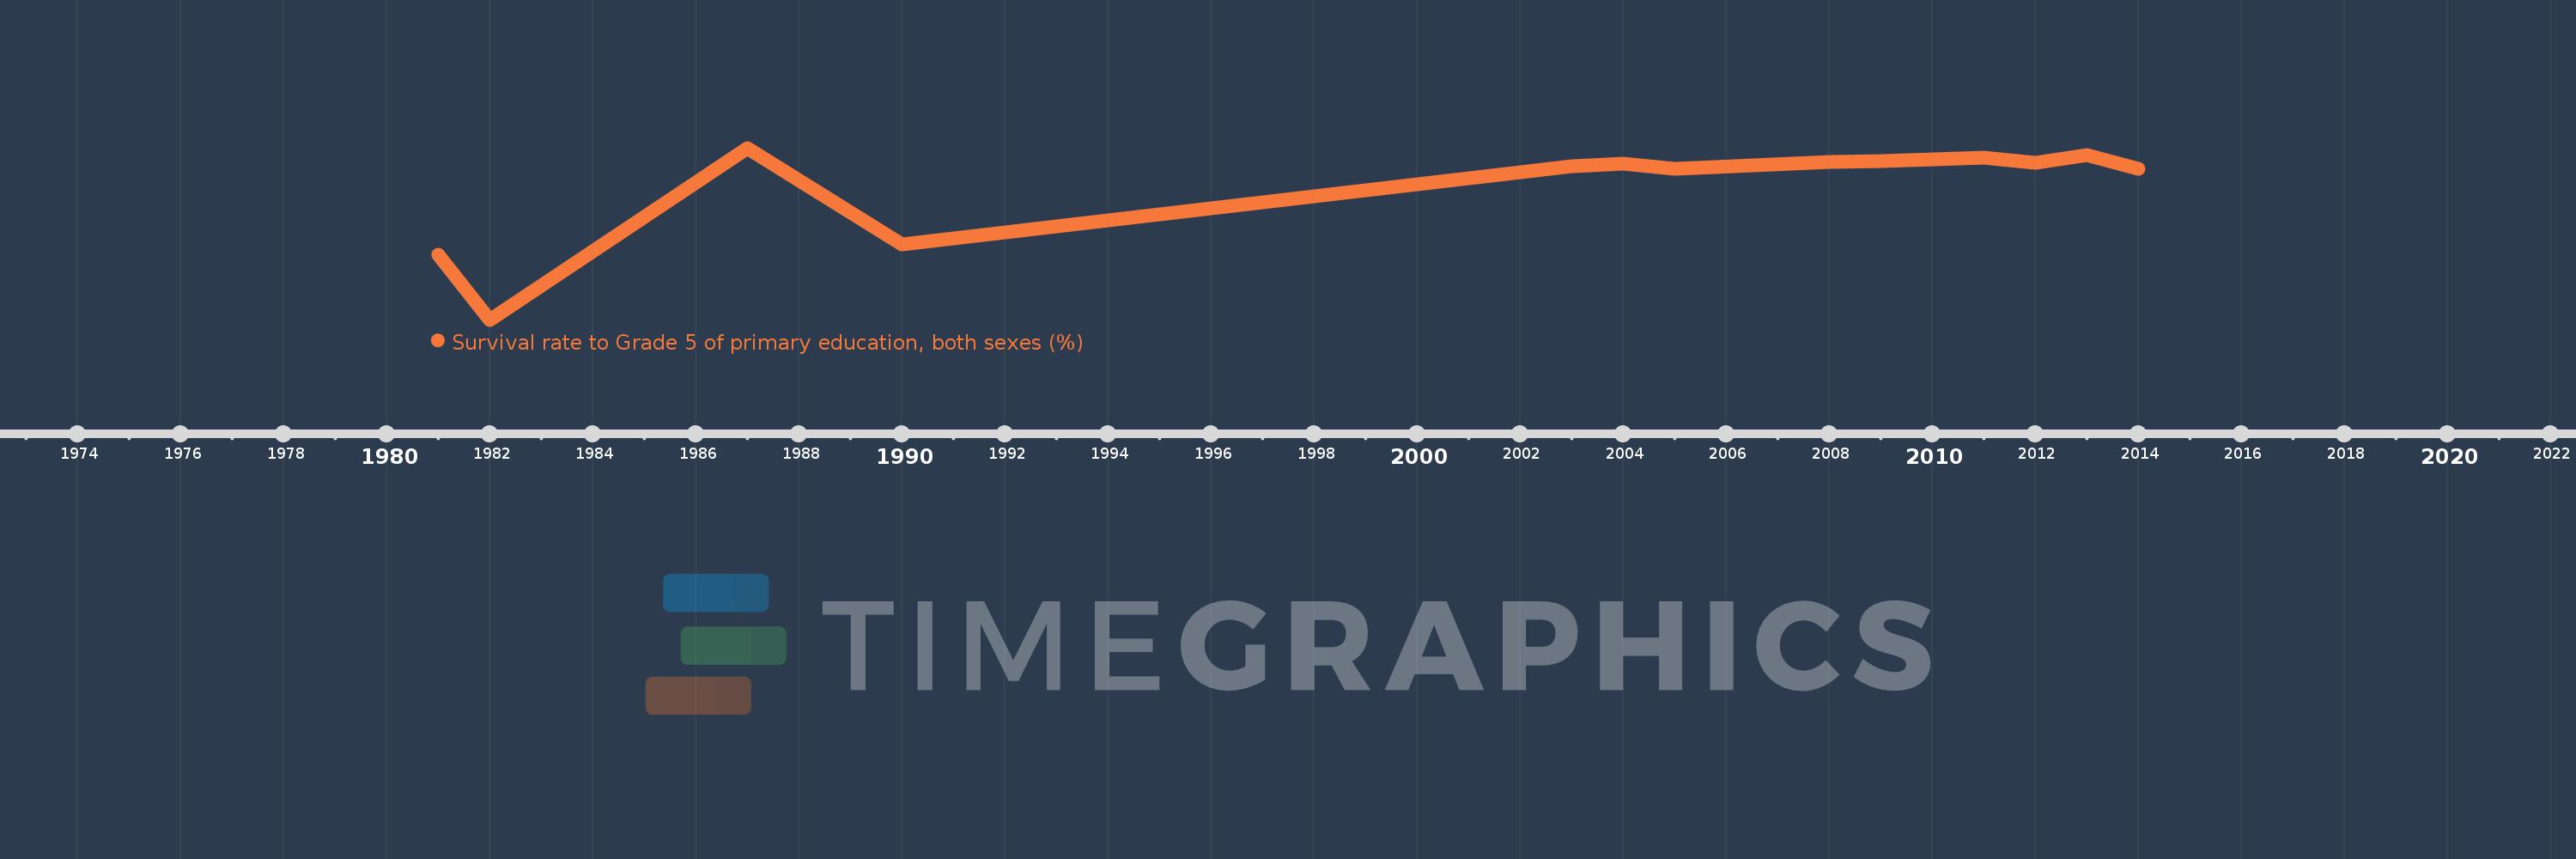
Nesta escala de tempo está apresentado um gráfico de 1981 ano até 2014 ano Hong Kong SAR, China. Dados de 1980 ano ausente. O número de observações reais por data: 13.

Fonte (nome):

Indicadores de desenvolvimento mundial

Fonte (organização):

UNESCO Institute for Statistics

Categorias:

Education

Foi atualizado:

23 abr 2017 ano

Indicadores de alterações dos valores ao longo dos anos

Em média:
99.065
Mínimo:
95.912
1 jan 1982 ano
Máximo:
100.0
1 jan 1987 ano
Na data de observação
Valor
Mudança absoluta
A alteração em relação ao valor anterior
1 jan 1981 ano
97.45
+97.45
0.0%
1 jan 1982 ano
95.912
-1.538
-1.58%
1 jan 1987 ano
100.0
+4.088
4.26%
1 jan 1990 ano
97.696
-2.304
-2.3%
1 jan 2003 ano
99.564
+1.868
1.91%
1 jan 2004 ano
99.622
+0.058
0.06%
1 jan 2005 ano
99.504
-0.118
-0.12%
1 jan 2008 ano
99.659
+0.156
0.16%
1 jan 2009 ano
99.679
+0.02
0.02%
1 jan 2011 ano
99.775
+0.095
0.1%
1 jan 2012 ano
99.643
-0.131
-0.13%
1 jan 2013 ano
99.837
+0.194
0.19%
1 jan 2014 ano
99.508
-0.329
-0.33%

Classificação de países por estatísticas atuais por anos