30
/pt/
AIzaSyAYiBZKx7MnpbEhh9jyipgxe19OcubqV5w
April 1, 2024
132686
Fiji
FJI
true
2
1
Survival rate to Grade 5 of primary education, both sexes (%)
2013,2012,2009,2008,2004,2002,2001,2000,1999,1995,1993,1987,1986,1985,1984,1982,1981,1980,1979,1974,1973
Download
Biblioteca de estatísticas globais →Fiji →

Survival rate to Grade 5 of primary education, both sexes (%)

Estas estatísticas em outros países:

AfghanistanAlbaniaAlgeriaAndorraAngolaAntigua and BarbudaArab WorldArgentinaArubaBahamas, TheBahrainBangladeshBarbadosBelarusBelgiumBelizeBeninBermudaBhutanBoliviaBosnia and HerzegovinaBotswanaBritish Virgin IslandsBrunei DarussalamBurkina FasoBurundiCabo VerdeCambodiaCameroonCanadaCaribbean small statesCayman IslandsCentral African RepublicChadChileChinaColombiaComorosCongo, Dem. Rep.Congo, Rep.Costa RicaCote d'IvoireCubaCyprusCzech RepublicDenmarkDjiboutiDominicaDominican RepublicEarly-demographic dividendEast Asia & PacificEast Asia & Pacific (excluding high income)East Asia & Pacific (IDA & IBRD countries)EcuadorEgypt, Arab Rep.El SalvadorEquatorial GuineaEritreaEstoniaEthiopiaFijiFinlandFranceGabonGambia, TheGeorgiaGhanaGreeceGrenadaGuatemalaGuineaGuinea-BissauGuyanaHaitiHeavily indebted poor countries (HIPC)HondurasHong Kong SAR, ChinaHungaryIBRD onlyIcelandIDA blendIDA onlyIDA totalIndiaIndonesiaIran, Islamic Rep.IraqIrelandIsraelItalyJamaicaJapanJordanKenyaKiribatiKorea, Rep.KuwaitLao PDRLate-demographic dividendLatviaLeast developed countries: UN classificationLebanonLesothoLiberiaLibyaLiechtensteinLow incomeLower middle incomeLuxembourgMacao SAR, ChinaMadagascarMalawiMalaysiaMaldivesMaliMaltaMarshall IslandsMauritaniaMauritiusMexicoMiddle East & North AfricaMiddle East & North Africa (excluding high income)Middle East & North Africa (IDA & IBRD countries)MonacoMontenegroMoroccoMozambiqueMyanmarNamibiaNepalNetherlandsNicaraguaNigerNigeriaNorwayOmanOther small statesPacific island small statesPakistanPanamaPapua New GuineaParaguayPeruPhilippinesPolandPortugalPre-demographic dividendQatarRwandaSamoaSan MarinoSao Tome and PrincipeSaudi ArabiaSenegalSeychellesSierra LeoneSingaporeSloveniaSolomon IslandsSouth AfricaSouth AsiaSouth Asia (IDA & IBRD)SpainSri LankaSt. Kitts and NevisSt. LuciaSt. Vincent and the GrenadinesSub-Saharan Africa Sub-Saharan Africa (excluding high income)Sub-Saharan Africa (IDA & IBRD countries)SudanSurinameSwazilandSwedenSwitzerlandSyrian Arab RepublicTanzaniaThailandTimor-LesteTogoTongaTrinidad and TobagoTunisiaTurkeyTuvaluUgandaUnited Arab EmiratesUpper middle incomeUruguayVanuatuVenezuela, RBVietnamYemen, Rep.ZambiaZimbabwe

Linha do tempo:

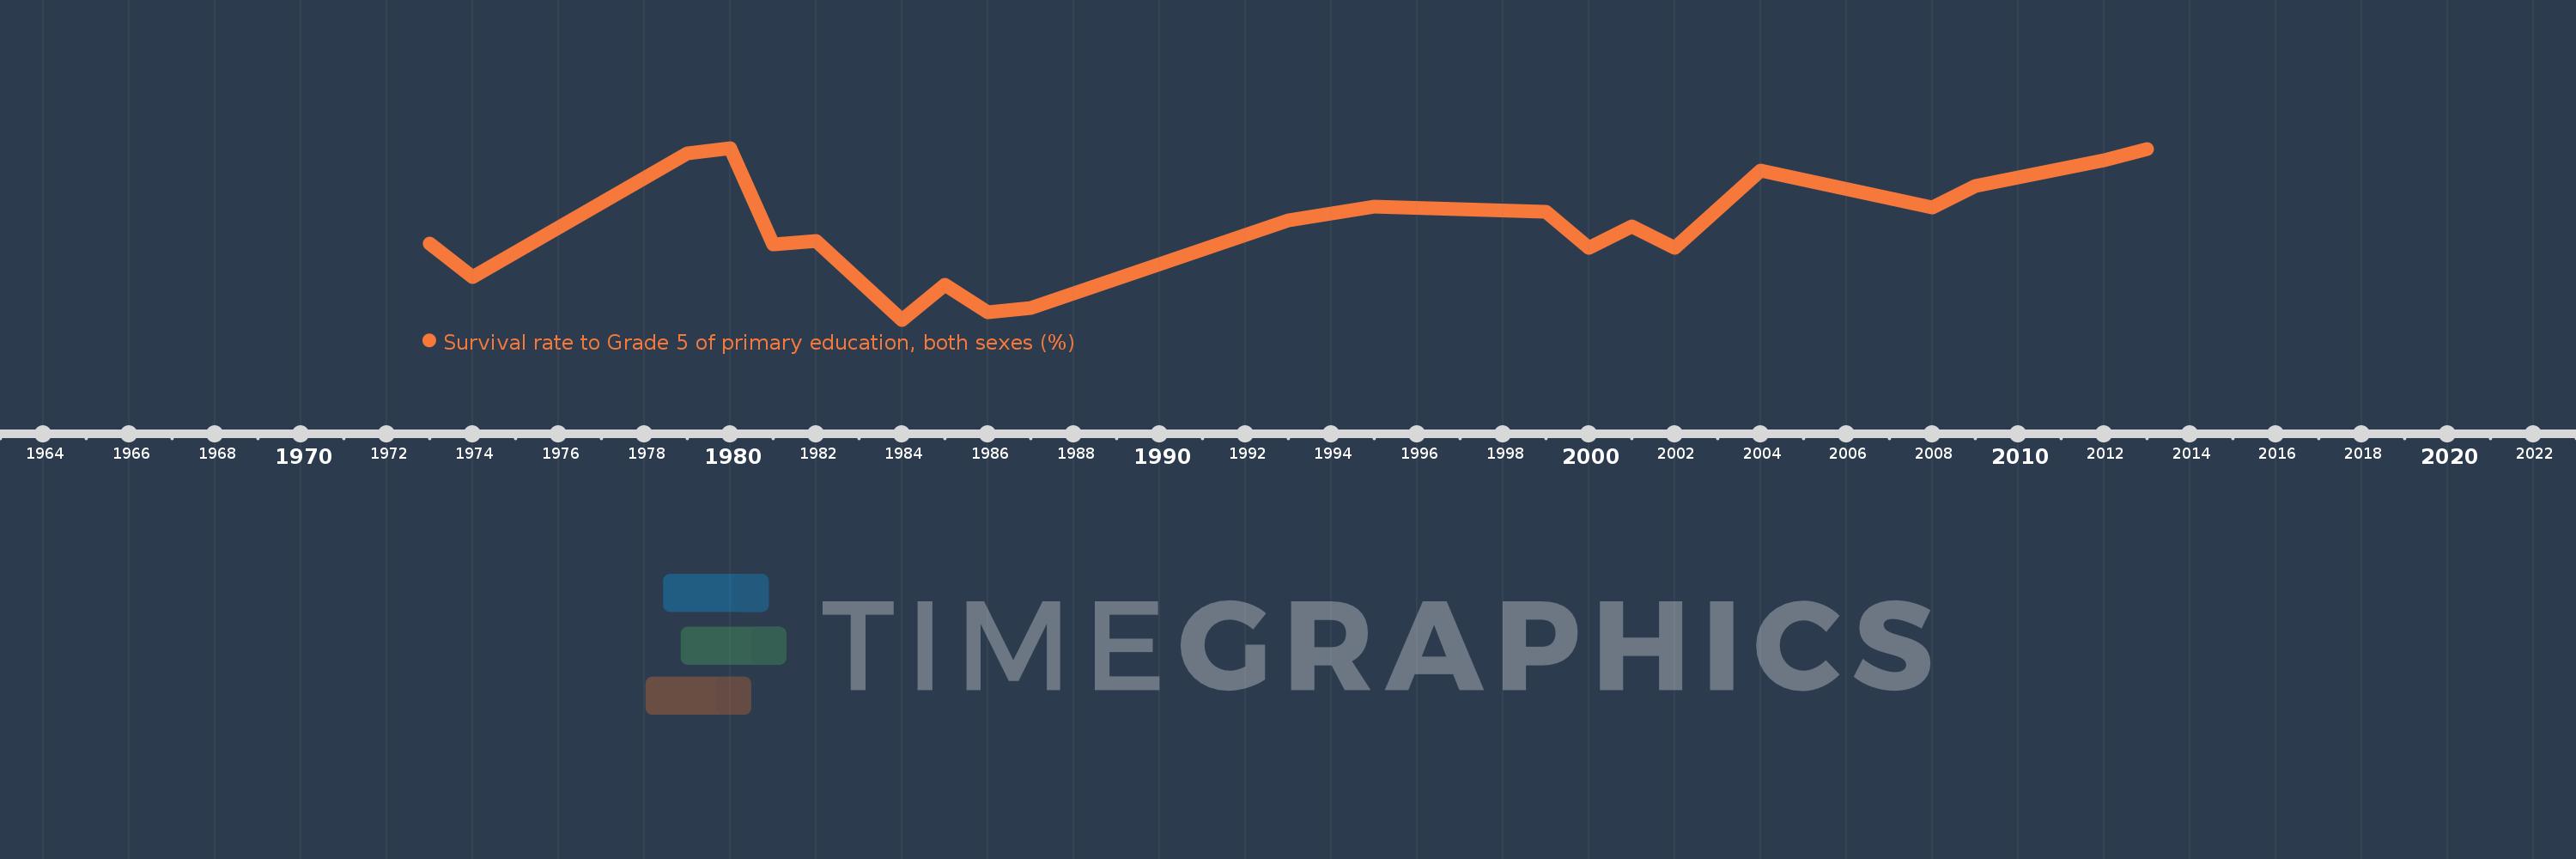
Nesta escala de tempo está apresentado um gráfico de 1973 ano até 2013 ano Fiji. Dados de 1972 ano ausente. O número de observações reais por data: 21.

Fonte (nome):

Indicadores de desenvolvimento mundial

Fonte (organização):

UNESCO Institute for Statistics

Categorias:

Education

Foi atualizado:

23 abr 2017 ano

Indicadores de alterações dos valores ao longo dos anos

Em média:
89.717
Mínimo:
79.416
1 jan 1984 ano
Máximo:
98.479
1 jan 1980 ano
Na data de observação
Valor
Mudança absoluta
A alteração em relação ao valor anterior
1 jan 1973 ano
87.831
+87.831
0.0%
1 jan 1974 ano
84.184
-3.647
-4.15%
1 jan 1979 ano
97.896
+13.712
16.29%
1 jan 1980 ano
98.479
+0.583
0.6%
1 jan 1981 ano
87.807
-10.672
-10.84%
1 jan 1982 ano
88.191
+0.383
0.44%
1 jan 1984 ano
79.416
-8.775
-9.95%
1 jan 1985 ano
83.273
+3.857
4.86%
1 jan 1986 ano
80.237
-3.036
-3.65%
1 jan 1987 ano
80.701
+0.463
0.58%
1 jan 1993 ano
90.49
+9.789
12.13%
1 jan 1995 ano
91.941
+1.451
1.6%
1 jan 1999 ano
91.387
-0.554
-0.6%
1 jan 2000 ano
87.433
-3.954
-4.33%
1 jan 2001 ano
89.814
+2.381
2.72%
1 jan 2002 ano
87.382
-2.432
-2.71%
1 jan 2004 ano
95.997
+8.616
9.86%
1 jan 2008 ano
91.851
-4.147
-4.32%
1 jan 2009 ano
94.286
+2.436
2.65%
1 jan 2012 ano
97.081
+2.795
2.96%
1 jan 2013 ano
98.381
+1.3
1.34%

Classificação de países por estatísticas atuais por anos