33
/pt/
AIzaSyAYiBZKx7MnpbEhh9jyipgxe19OcubqV5w
August 1, 2025
136197
Gabon
GAB
true
2
1
Survival rate to Grade 5 of primary education, both sexes (%)
2003,1998,1997,1993,1990,1989,1988,1986,1985,1984,1983,1982,1981,1980,1979,1978,1977,1976,1974,1973
Download
Biblioteca de estatísticas globais →Gabon →

Survival rate to Grade 5 of primary education, both sexes (%)

Estas estatísticas em outros países:

AfghanistanAlbaniaAlgeriaAndorraAngolaAntigua and BarbudaArab WorldArgentinaArubaBahamas, TheBahrainBangladeshBarbadosBelarusBelgiumBelizeBeninBermudaBhutanBoliviaBosnia and HerzegovinaBotswanaBritish Virgin IslandsBrunei DarussalamBurkina FasoBurundiCabo VerdeCambodiaCameroonCanadaCaribbean small statesCayman IslandsCentral African RepublicChadChileChinaColombiaComorosCongo, Dem. Rep.Congo, Rep.Costa RicaCote d'IvoireCubaCyprusCzech RepublicDenmarkDjiboutiDominicaDominican RepublicEarly-demographic dividendEast Asia & PacificEast Asia & Pacific (excluding high income)East Asia & Pacific (IDA & IBRD countries)EcuadorEgypt, Arab Rep.El SalvadorEquatorial GuineaEritreaEstoniaEthiopiaFijiFinlandFranceGabonGambia, TheGeorgiaGhanaGreeceGrenadaGuatemalaGuineaGuinea-BissauGuyanaHaitiHeavily indebted poor countries (HIPC)HondurasHong Kong SAR, ChinaHungaryIBRD onlyIcelandIDA blendIDA onlyIDA totalIndiaIndonesiaIran, Islamic Rep.IraqIrelandIsraelItalyJamaicaJapanJordanKenyaKiribatiKorea, Rep.KuwaitLao PDRLate-demographic dividendLatviaLeast developed countries: UN classificationLebanonLesothoLiberiaLibyaLiechtensteinLow incomeLower middle incomeLuxembourgMacao SAR, ChinaMadagascarMalawiMalaysiaMaldivesMaliMaltaMarshall IslandsMauritaniaMauritiusMexicoMiddle East & North AfricaMiddle East & North Africa (excluding high income)Middle East & North Africa (IDA & IBRD countries)MonacoMontenegroMoroccoMozambiqueMyanmarNamibiaNepalNetherlandsNicaraguaNigerNigeriaNorwayOmanOther small statesPacific island small statesPakistanPanamaPapua New GuineaParaguayPeruPhilippinesPolandPortugalPre-demographic dividendQatarRwandaSamoaSan MarinoSao Tome and PrincipeSaudi ArabiaSenegalSeychellesSierra LeoneSingaporeSloveniaSolomon IslandsSouth AfricaSouth AsiaSouth Asia (IDA & IBRD)SpainSri LankaSt. Kitts and NevisSt. LuciaSt. Vincent and the GrenadinesSub-Saharan Africa Sub-Saharan Africa (excluding high income)Sub-Saharan Africa (IDA & IBRD countries)SudanSurinameSwazilandSwedenSwitzerlandSyrian Arab RepublicTanzaniaThailandTimor-LesteTogoTongaTrinidad and TobagoTunisiaTurkeyTuvaluUgandaUnited Arab EmiratesUpper middle incomeUruguayVanuatuVenezuela, RBVietnamYemen, Rep.ZambiaZimbabwe

Linha do tempo:

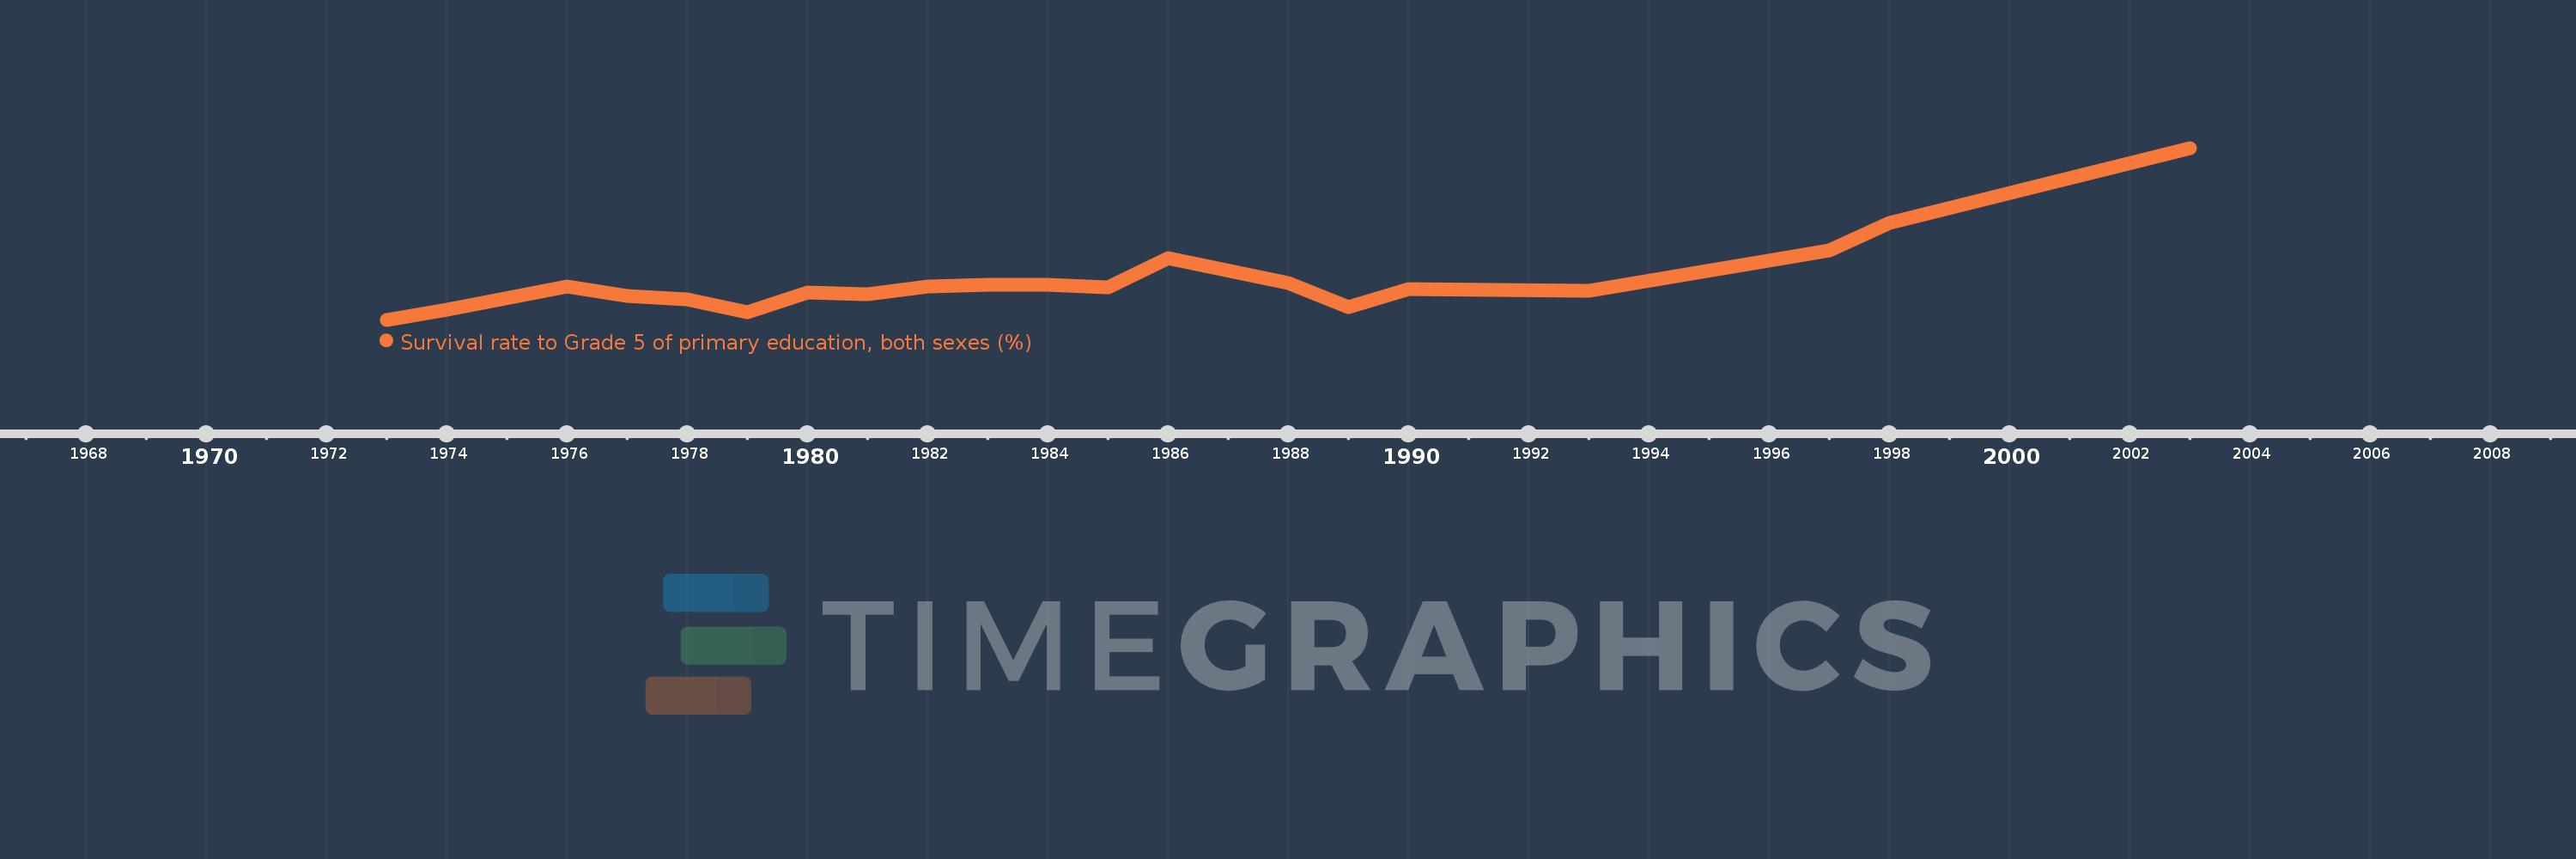
Nesta escala de tempo está apresentado um gráfico de 1973 ano até 2003 ano Gabon. Dados de 1972 ano ausente. O número de observações reais por data: 20.

Fonte (nome):

Indicadores de desenvolvimento mundial

Fonte (organização):

UNESCO Institute for Statistics

Categorias:

Education

Foi atualizado:

23 abr 2017 ano

Indicadores de alterações dos valores ao longo dos anos

Em média:
48.577
Mínimo:
41.455
1 jan 1973 ano
Máximo:
72.301
1 jan 2003 ano
Na data de observação
Valor
Mudança absoluta
A alteração em relação ao valor anterior
1 jan 1973 ano
41.455
+41.455
0.0%
1 jan 1974 ano
43.28
+1.826
4.4%
1 jan 1976 ano
47.433
+4.153
9.6%
1 jan 1977 ano
45.795
-1.638
-3.45%
1 jan 1978 ano
45.183
-0.613
-1.34%
1 jan 1979 ano
42.861
-2.322
-5.14%
1 jan 1980 ano
46.283
+3.422
7.98%
1 jan 1981 ano
46.104
-0.179
-0.39%
1 jan 1982 ano
47.357
+1.253
2.72%
1 jan 1983 ano
47.705
+0.348
0.73%
1 jan 1984 ano
47.793
+0.088
0.18%
1 jan 1985 ano
47.292
-0.502
-1.05%
1 jan 1986 ano
52.552
+5.261
11.12%
1 jan 1988 ano
47.987
-4.565
-8.69%
1 jan 1989 ano
43.761
-4.226
-8.81%
1 jan 1990 ano
46.926
+3.164
7.23%
1 jan 1993 ano
46.663
-0.263
-0.56%
1 jan 1997 ano
53.948
+7.285
15.61%
1 jan 1998 ano
58.864
+4.916
9.11%
1 jan 2003 ano
72.301
+13.437
22.83%

Classificação de países por estatísticas atuais por anos