33
/it/
AIzaSyAYiBZKx7MnpbEhh9jyipgxe19OcubqV5w
August 1, 2025
99376
Cambodia
KHM
true
2
1
Total debt service (% of GNI)
2016,2015,2014,2013,2012,2011,2010,2009,2008,2007,2006,2005,2004,2003,2002,2001,2000,1999,1998,1997,1996
Download
Biblioteca di statistiche globali →Cambodia →

Total debt service (% of GNI)

Queste statistiche in altri paesi:

AfghanistanAlbaniaAlgeriaAngolaArab WorldArgentinaArmeniaAzerbaijanBangladeshBelarusBelizeBeninBhutanBoliviaBosnia and HerzegovinaBotswanaBrazilBulgariaBurkina FasoBurundiCabo VerdeCambodiaCameroonCentral African RepublicCentral Europe and the BalticsChadChinaColombiaComorosCongo, Dem. Rep.Congo, Rep.Costa RicaCote d'IvoireDjiboutiDominicaDominican RepublicEarly-demographic dividendEast Asia & Pacific (excluding high income)East Asia & Pacific (IDA & IBRD countries)EcuadorEgypt, Arab Rep.El SalvadorEritreaEthiopiaEurope & Central Asia (excluding high income)Europe & Central Asia (IDA & IBRD countries)FijiFragile and conflict affected situationsGabonGambia, TheGeorgiaGhanaGrenadaGuatemalaGuineaGuinea-BissauGuyanaHaitiHeavily indebted poor countries (HIPC)HondurasIBRD onlyIDA & IBRD totalIDA blendIDA onlyIDA totalIndiaIndonesiaIran, Islamic Rep.JamaicaJordanKazakhstanKenyaKosovoKyrgyz RepublicLao PDRLate-demographic dividendLatin America & Caribbean Latin America & Caribbean (excluding high income)Latin America & the Caribbean (IDA & IBRD countries)Least developed countries: UN classificationLebanonLesothoLiberiaLow & middle incomeLow incomeLower middle incomeMacedonia, FYRMadagascarMalawiMalaysiaMaldivesMaliMauritaniaMauritiusMexicoMiddle East & North Africa (excluding high income)Middle East & North Africa (IDA & IBRD countries)Middle incomeMoldovaMongoliaMontenegroMoroccoMozambiqueMyanmarNepalNicaraguaNigerNigeriaPacific island small statesPakistanPanamaPapua New GuineaParaguayPeruPhilippinesPre-demographic dividendRomaniaRussian FederationRwandaSamoaSao Tome and PrincipeSenegalSerbiaSierra LeoneSolomon IslandsSomaliaSouth AfricaSouth AsiaSouth Asia (IDA & IBRD)Sri LankaSt. LuciaSt. Vincent and the GrenadinesSub-Saharan Africa Sub-Saharan Africa (excluding high income)Sub-Saharan Africa (IDA & IBRD countries)SudanSwazilandSyrian Arab RepublicTajikistanTanzaniaThailandTogoTongaTunisiaTurkeyTurkmenistanUgandaUkraineUpper middle incomeUzbekistanVanuatuVenezuela, RBVietnamYemen, Rep.ZambiaZimbabwe

Linea del tempo:

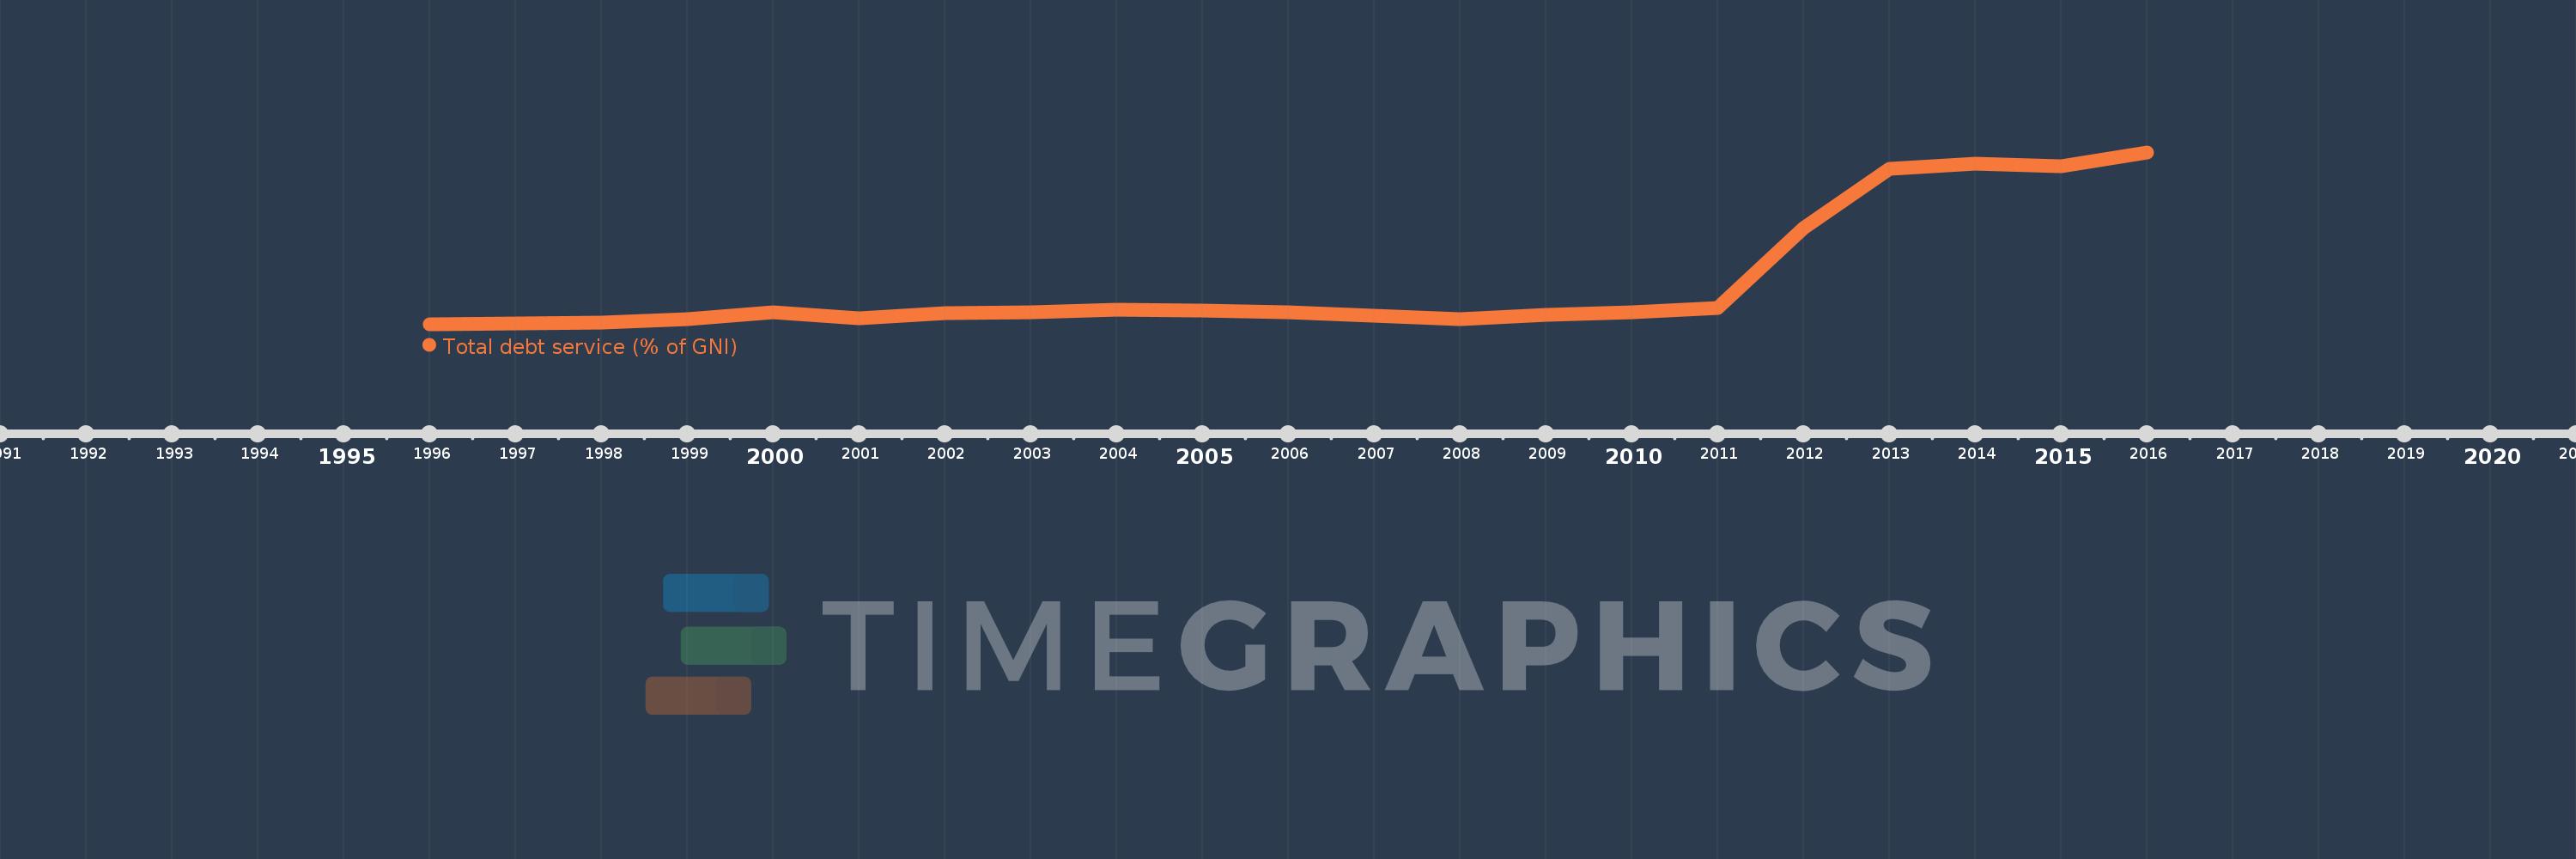
Questa scala temporale mostra un grafico dal 1996 anno al 2016 anno. Cambodia. I dati fino ad 1995 anno non disponibili. Il numero di osservazioni attuali secondo i date: 21.

La fonte (nome):

Indicatori dello sviluppo mondiale

La fonte (organizzazione):

World Bank, International Debt Statistics.

Categorie:

Economy & Growth, External Debt

sono stati aggiornati

23 apr 2017 anni

Indicatori delle variazioni dei valori per anni

In media:
1.255
Minima:
0.195
1 gen 1996 anni
Massimo:
4.535
1 gen 2016 anni
Alla data di osservazione
Valore
Variazione assoluta
La variazione rispetto al valore precedente
1 gen 1996 anni
0.195
+0.195
0.0%
1 gen 1997 anni
0.218
+0.023
11.9%
1 gen 1998 anni
0.234
+0.016
7.37%
1 gen 1999 anni
0.317
+0.083
35.33%
1 gen 2000 anni
0.49
+0.173
54.59%
1 gen 2001 anni
0.355
-0.135
-27.54%
1 gen 2002 anni
0.481
+0.126
35.51%
1 gen 2003 anni
0.499
+0.018
3.74%
1 gen 2004 anni
0.566
+0.067
13.53%
1 gen 2005 anni
0.536
-0.03
-5.25%
1 gen 2006 anni
0.495
-0.042
-7.8%
1 gen 2007 anni
0.42
-0.074
-15.01%
1 gen 2008 anni
0.329
-0.091
-21.66%
1 gen 2009 anni
0.421
+0.091
27.74%
1 gen 2010 anni
0.497
+0.077
18.2%
1 gen 2011 anni
0.609
+0.112
22.54%
1 gen 2012 anni
2.628
+2.019
331.48%
1 gen 2013 anni
4.111
+1.482
56.39%
1 gen 2014 anni
4.241
+0.13
3.17%
1 gen 2015 anni
4.18
-0.061
-1.43%
1 gen 2016 anni
4.535
+0.355
8.49%

Classificazione dei paesi secondo i statistiche attuali per anni