33
/it/
AIzaSyAYiBZKx7MnpbEhh9jyipgxe19OcubqV5w
August 1, 2025
110443
Congo, Dem. Rep.
COD
true
2
1
Total debt service (% of GNI)
2016,2015,2014,2013,2012,2011,2010,2009,2008,2007,2006,2005,2004,2003,2002,2001,2000,1999,1998,1997,1996,1995
Download
Biblioteca di statistiche globali →Congo, Dem. Rep. →

Total debt service (% of GNI)

Queste statistiche in altri paesi:

AfghanistanAlbaniaAlgeriaAngolaArab WorldArgentinaArmeniaAzerbaijanBangladeshBelarusBelizeBeninBhutanBoliviaBosnia and HerzegovinaBotswanaBrazilBulgariaBurkina FasoBurundiCabo VerdeCambodiaCameroonCentral African RepublicCentral Europe and the BalticsChadChinaColombiaComorosCongo, Dem. Rep.Congo, Rep.Costa RicaCote d'IvoireDjiboutiDominicaDominican RepublicEarly-demographic dividendEast Asia & Pacific (excluding high income)East Asia & Pacific (IDA & IBRD countries)EcuadorEgypt, Arab Rep.El SalvadorEritreaEthiopiaEurope & Central Asia (excluding high income)Europe & Central Asia (IDA & IBRD countries)FijiFragile and conflict affected situationsGabonGambia, TheGeorgiaGhanaGrenadaGuatemalaGuineaGuinea-BissauGuyanaHaitiHeavily indebted poor countries (HIPC)HondurasIBRD onlyIDA & IBRD totalIDA blendIDA onlyIDA totalIndiaIndonesiaIran, Islamic Rep.JamaicaJordanKazakhstanKenyaKosovoKyrgyz RepublicLao PDRLate-demographic dividendLatin America & Caribbean Latin America & Caribbean (excluding high income)Latin America & the Caribbean (IDA & IBRD countries)Least developed countries: UN classificationLebanonLesothoLiberiaLow & middle incomeLow incomeLower middle incomeMacedonia, FYRMadagascarMalawiMalaysiaMaldivesMaliMauritaniaMauritiusMexicoMiddle East & North Africa (excluding high income)Middle East & North Africa (IDA & IBRD countries)Middle incomeMoldovaMongoliaMontenegroMoroccoMozambiqueMyanmarNepalNicaraguaNigerNigeriaPacific island small statesPakistanPanamaPapua New GuineaParaguayPeruPhilippinesPre-demographic dividendRomaniaRussian FederationRwandaSamoaSao Tome and PrincipeSenegalSerbiaSierra LeoneSolomon IslandsSomaliaSouth AfricaSouth AsiaSouth Asia (IDA & IBRD)Sri LankaSt. LuciaSt. Vincent and the GrenadinesSub-Saharan Africa Sub-Saharan Africa (excluding high income)Sub-Saharan Africa (IDA & IBRD countries)SudanSwazilandSyrian Arab RepublicTajikistanTanzaniaThailandTogoTongaTunisiaTurkeyTurkmenistanUgandaUkraineUpper middle incomeUzbekistanVanuatuVenezuela, RBVietnamYemen, Rep.ZambiaZimbabwe

Linea del tempo:

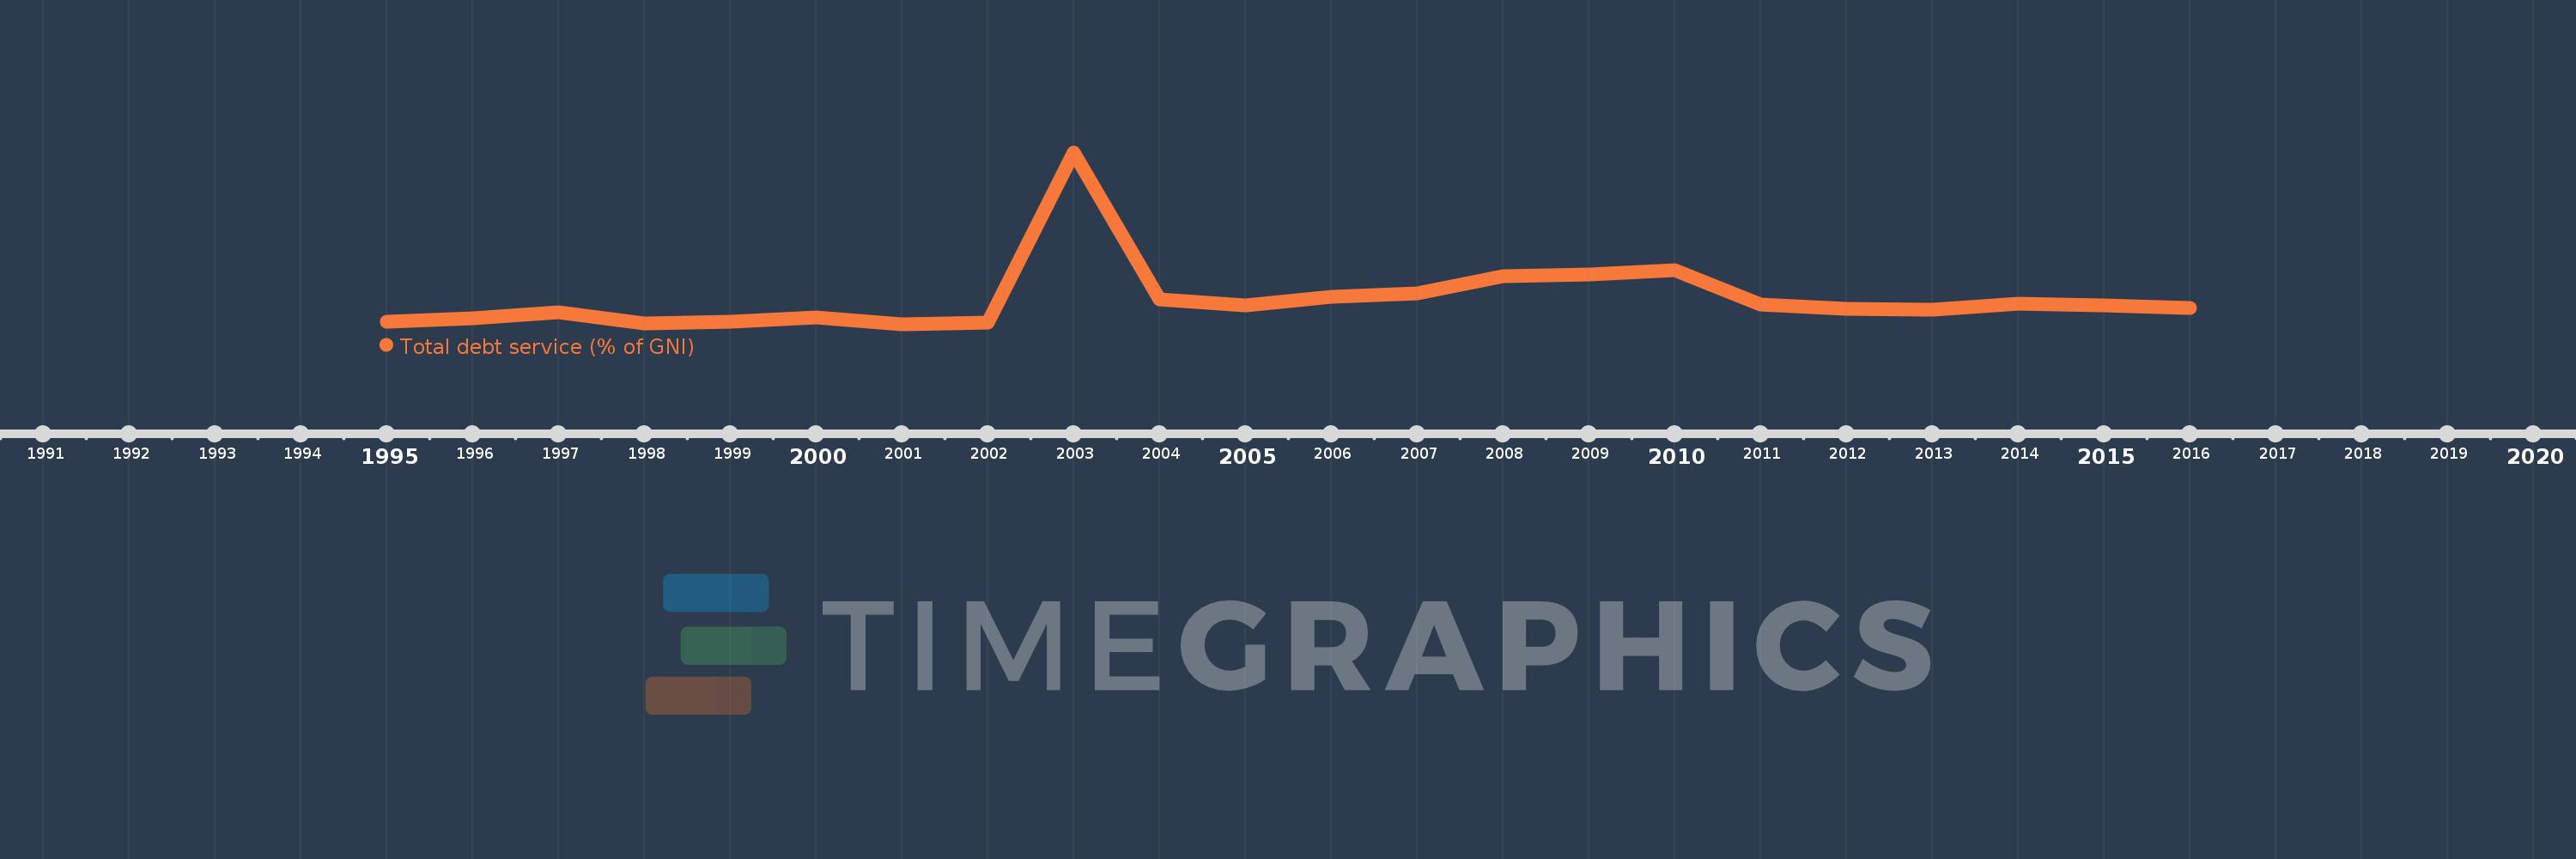
Questa scala temporale mostra un grafico dal 1995 anno al 2016 anno. Congo, Dem. Rep.. I dati fino ad 1994 anno non disponibili. Il numero di osservazioni attuali secondo i date: 22.

La fonte (nome):

Indicatori dello sviluppo mondiale

La fonte (organizzazione):

World Bank, International Debt Statistics.

Categorie:

Economy & Growth, External Debt

sono stati aggiornati

23 apr 2017 anni

Indicatori delle variazioni dei valori per anni

In media:
1.777
Minima:
0.159
1 gen 2001 anni
Massimo:
11.019
1 gen 2003 anni
Alla data di osservazione
Valore
Variazione assoluta
La variazione rispetto al valore precedente
1 gen 1995 anni
0.305
+0.305
0.0%
1 gen 1996 anni
0.512
+0.207
67.9%
1 gen 1997 anni
0.897
+0.385
75.29%
1 gen 1998 anni
0.22
-0.676
-75.44%
1 gen 1999 anni
0.332
+0.112
50.77%
1 gen 2000 anni
0.586
+0.254
76.54%
1 gen 2001 anni
0.159
-0.427
-72.86%
1 gen 2002 anni
0.286
+0.127
79.99%
1 gen 2003 anni
11.019
+10.733
3.75 Mille.%
1 gen 2004 anni
1.702
-9.317
-84.56%
1 gen 2005 anni
1.337
-0.365
-21.44%
1 gen 2006 anni
1.902
+0.565
42.29%
1 gen 2007 anni
2.096
+0.194
10.18%
1 gen 2008 anni
3.186
+1.09
52.03%
1 gen 2009 anni
3.317
+0.13
4.09%
1 gen 2010 anni
3.577
+0.26
7.85%
1 gen 2011 anni
1.402
-2.175
-60.8%
1 gen 2012 anni
1.137
-0.265
-18.93%
1 gen 2013 anni
1.079
-0.058
-5.08%
1 gen 2014 anni
1.473
+0.394
36.53%
1 gen 2015 anni
1.372
-0.101
-6.86%
1 gen 2016 anni
1.2
-0.172
-12.51%

Classificazione dei paesi secondo i statistiche attuali per anni