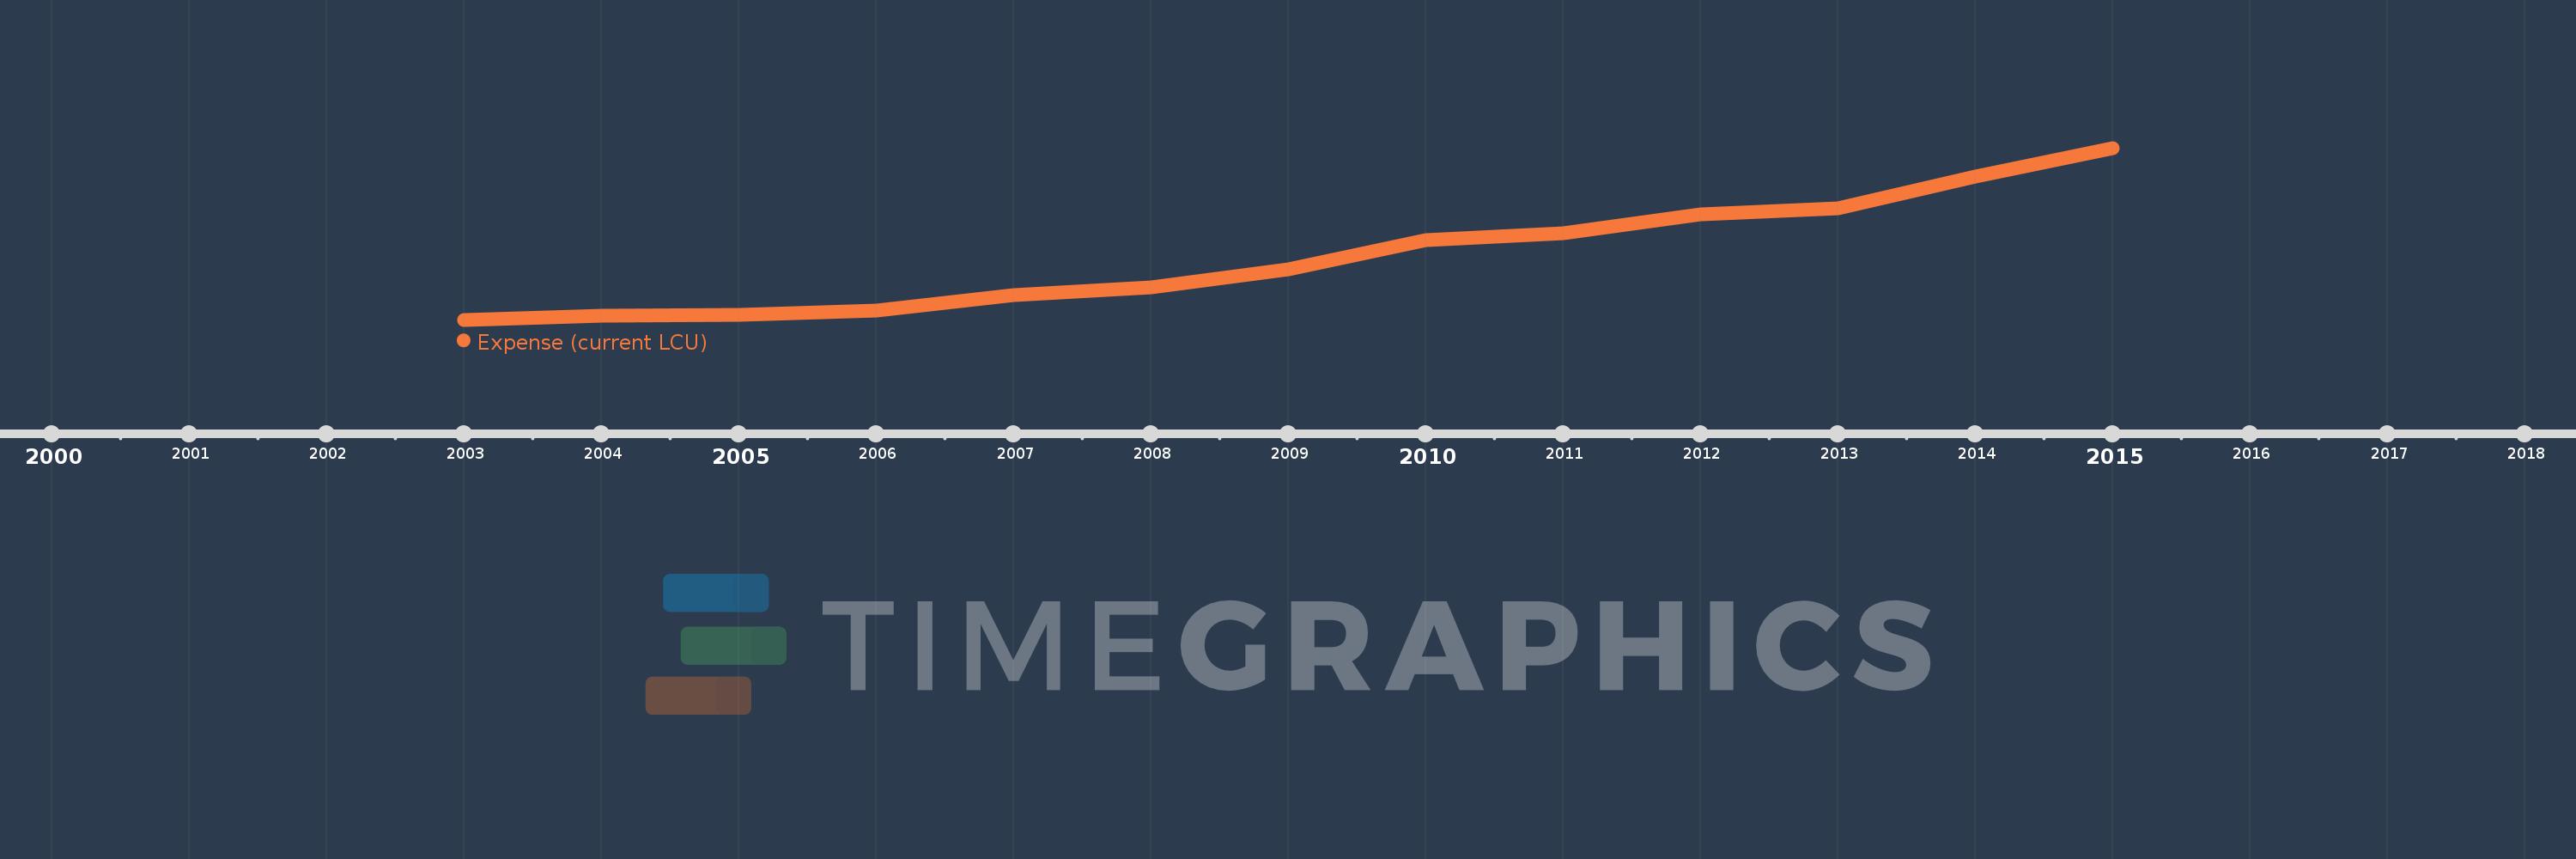
Questa scala temporale mostra un grafico dal 2003 anno al 2015 anno. Cambodia. I dati fino ad 2002 anno non disponibili. Il numero di osservazioni attuali secondo i date: 13.
La fonte (nome):
Indicatori dello sviluppo mondiale
La fonte (organizzazione):
International Monetary Fund, Government Finance Statistics Yearbook and data files.
Categorie:
Public Sector
sono stati aggiornati
23 apr 2017 anni
Indicatori delle variazioni dei valori per anni
In media:
4.091 Trln
Minima:
1.574 Trln
1 gen 2003 anni
Massimo:
8.398 Trln
1 gen 2015 anni
Alla data di osservazione
Valore
Variazione assoluta
La variazione rispetto al valore precedente
1 gen 2003 anni
1.574 Trln
+1.574 Trln
0.0%
1 gen 2004 anni
1.722 Trln
+147.995 Mlrd
9.4%
1 gen 2005 anni
1.754 Trln
+31.551 Mlrd
1.83%
1 gen 2006 anni
1.955 Trln
+201.317 Mlrd
11.48%
1 gen 2007 anni
2.563 Trln
+608.185 Mlrd
31.11%
1 gen 2008 anni
2.874 Trln
+310.702 Mlrd
12.12%
1 gen 2009 anni
3.593 Trln
+718.68 Mlrd
25.01%
1 gen 2010 anni
4.721 Trln
+1.129 Trln
31.42%
1 gen 2011 anni
5.003 Trln
+281.029 Mlrd
5.95%
1 gen 2012 anni
5.754 Trln
+751.824 Mlrd
15.03%
1 gen 2013 anni
5.993 Trln
+238.81 Mlrd
4.15%
1 gen 2014 anni
7.274 Trln
+1.281 Trln
21.38%
1 gen 2015 anni
8.398 Trln
+1.123 Trln
15.44%
Classificazione dei paesi secondo i statistiche attuali per anni