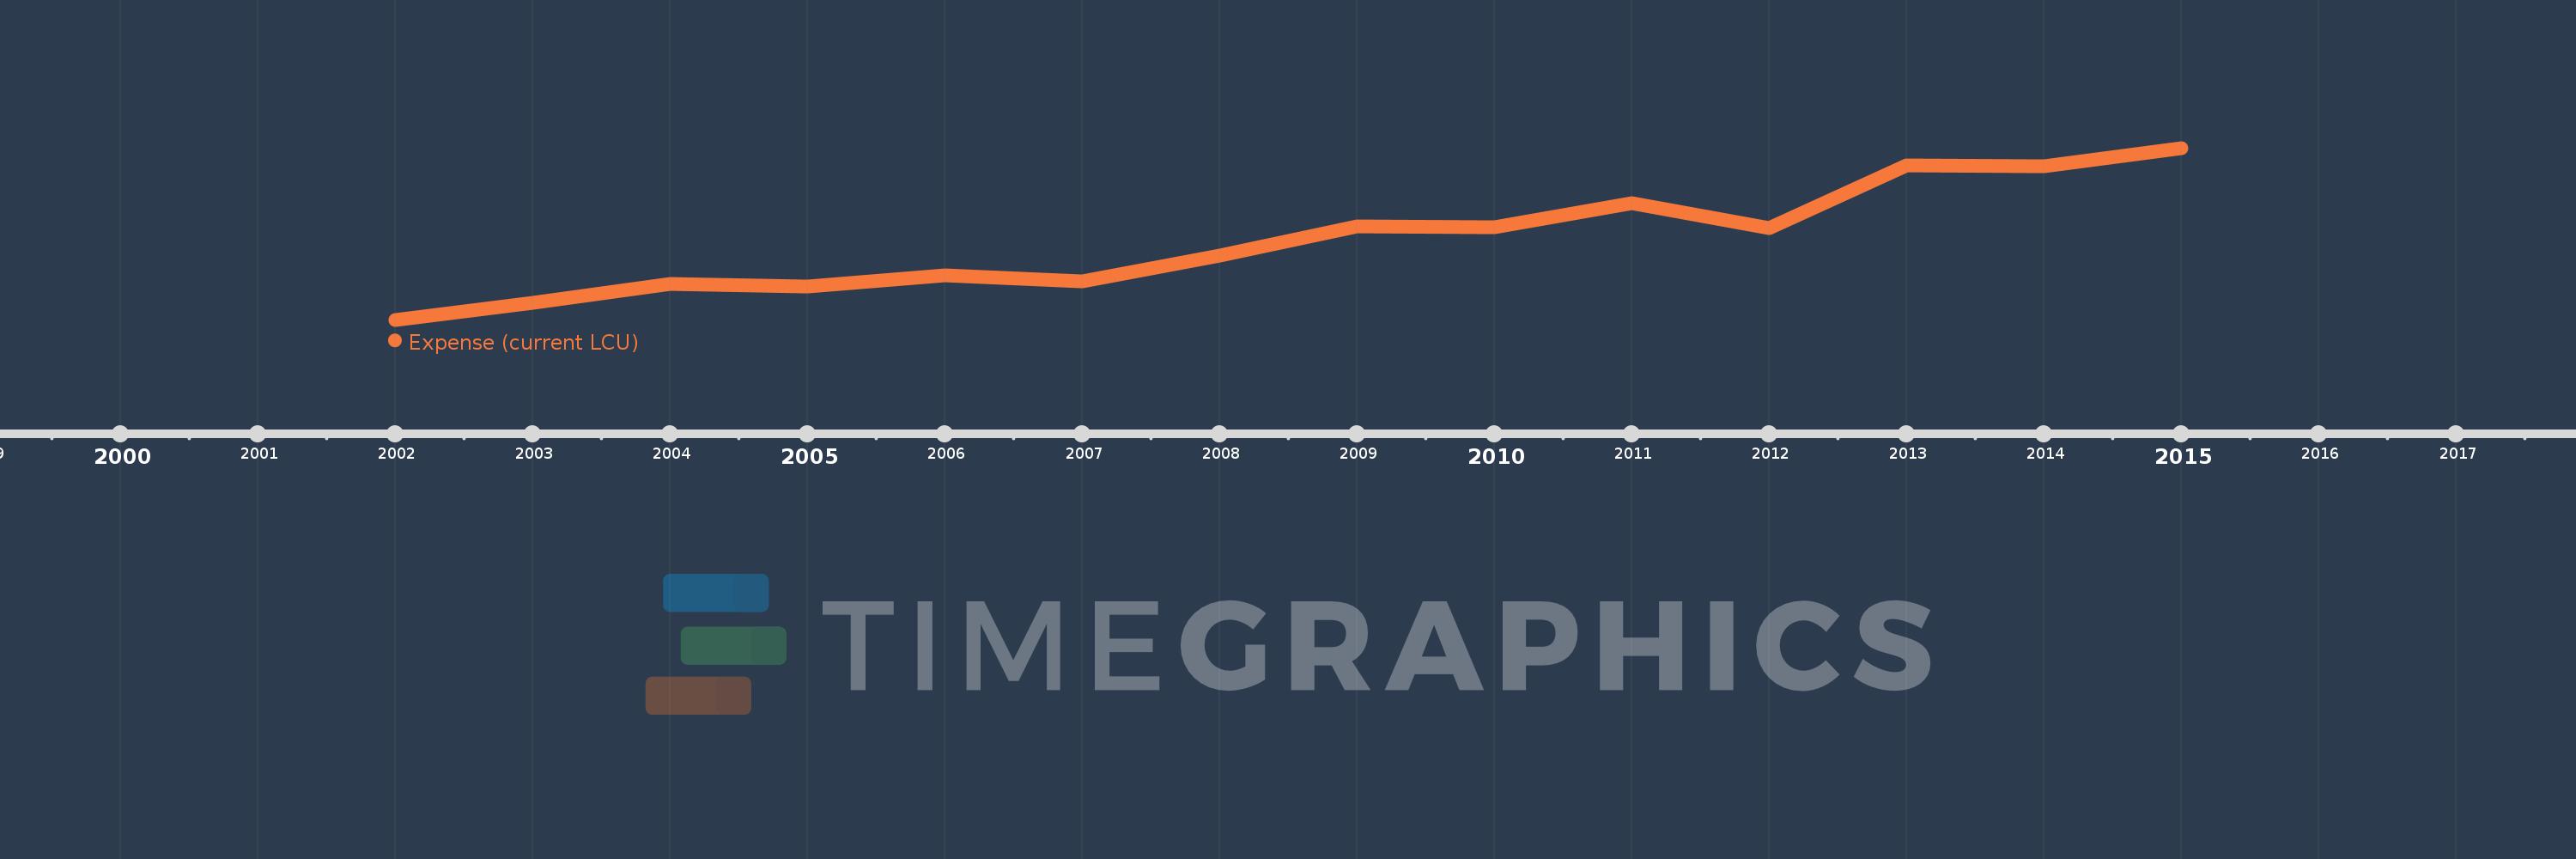
Questa scala temporale mostra un grafico dal 2002 anno al 2015 anno. Cote d'Ivoire. I dati fino ad 2001 anno non disponibili. Il numero di osservazioni attuali secondo i date: 14.
La fonte (nome):
Indicatori dello sviluppo mondiale
La fonte (organizzazione):
International Monetary Fund, Government Finance Statistics Yearbook and data files.
Categorie:
Public Sector
sono stati aggiornati
23 apr 2017 anni
Indicatori delle variazioni dei valori per anni
In media:
1.574 Trln
Minima:
1.021 Trln
1 gen 2002 anni
Massimo:
2.223 Trln
1 gen 2015 anni
Alla data di osservazione
Valore
Variazione assoluta
La variazione rispetto al valore precedente
1 gen 2002 anni
1.021 Trln
+1.021 Trln
0.0%
1 gen 2003 anni
1.138 Trln
+116.386 Mlrd
11.4%
1 gen 2004 anni
1.272 Trln
+134.142 Mlrd
11.79%
1 gen 2005 anni
1.253 Trln
-18.6 Mlrd
-1.46%
1 gen 2006 anni
1.334 Trln
+81.2 Mlrd
6.48%
1 gen 2007 anni
1.288 Trln
-46.2 Mlrd
-3.46%
1 gen 2008 anni
1.468 Trln
+179.5 Mlrd
13.94%
1 gen 2009 anni
1.675 Trln
+207.3 Mlrd
14.13%
1 gen 2010 anni
1.67 Trln
-4.94 Mlrd
-0.29%
1 gen 2011 anni
1.837 Trln
+166.75 Mlrd
9.99%
1 gen 2012 anni
1.662 Trln
-174.99 Mlrd
-9.53%
1 gen 2013 anni
2.098 Trln
+436.66 Mlrd
26.28%
1 gen 2014 anni
2.097 Trln
-1.11 Mlrd
-0.05%
1 gen 2015 anni
2.223 Trln
+125.394 Mlrd
5.98%
Classificazione dei paesi secondo i statistiche attuali per anni