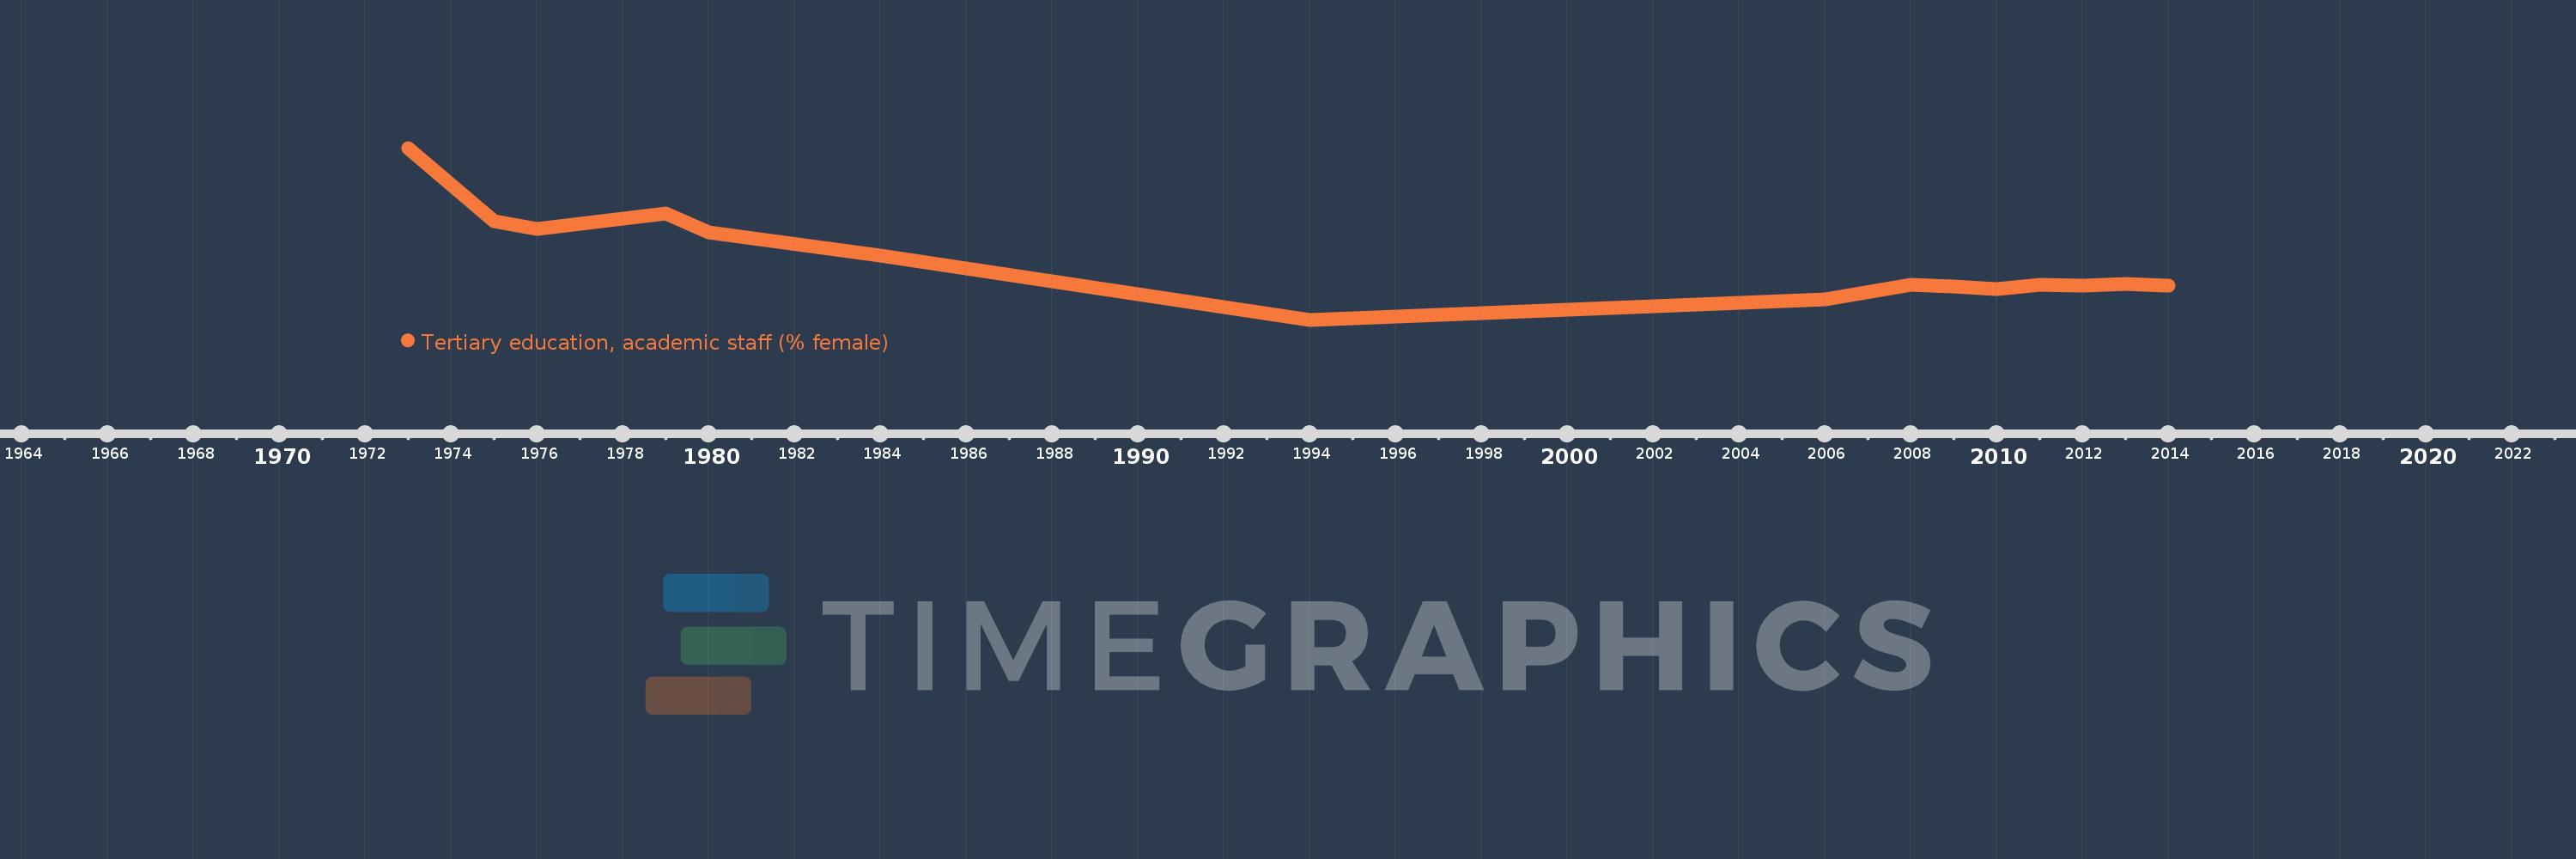
Questa scala temporale mostra un grafico dal 1973 anno al 2014 anno. Burkina Faso. I dati fino ad 1972 anno non disponibili. Il numero di osservazioni attuali secondo i date: 15.
La fonte (nome):
Indicatori dello sviluppo mondiale
La fonte (organizzazione):
United Nations Educational, Scientific, and Cultural Organization (UNESCO) Institute for Statistics.
Categorie:
Education
sono stati aggiornati
23 apr 2017 anni
Indicatori delle variazioni dei valori per anni
In media:
12.803
Minima:
2.194
1 gen 1994 anni
Massimo:
33.333
1 gen 1973 anni
Alla data di osservazione
Valore
Variazione assoluta
La variazione rispetto al valore precedente
1 gen 1973 anni
33.333
+33.333
0.0%
1 gen 1975 anni
20.0
-13.333
-40.0%
1 gen 1976 anni
18.627
-1.373
-6.86%
1 gen 1979 anni
21.505
+2.878
15.45%
1 gen 1980 anni
18.103
-3.402
-15.82%
1 gen 1984 anni
13.841
-4.263
-23.55%
1 gen 1994 anni
2.194
-11.647
-84.15%
1 gen 2006 anni
5.948
+3.754
171.11%
1 gen 2008 anni
8.537
+2.589
43.53%
1 gen 2009 anni
8.151
-0.385
-4.51%
1 gen 2010 anni
7.793
-0.358
-4.39%
1 gen 2011 anni
8.515
+0.722
9.26%
1 gen 2012 anni
8.411
-0.104
-1.22%
1 gen 2013 anni
8.744
+0.333
3.96%
1 gen 2014 anni
8.347
-0.398
-4.55%
Classificazione dei paesi secondo i statistiche attuali per anni