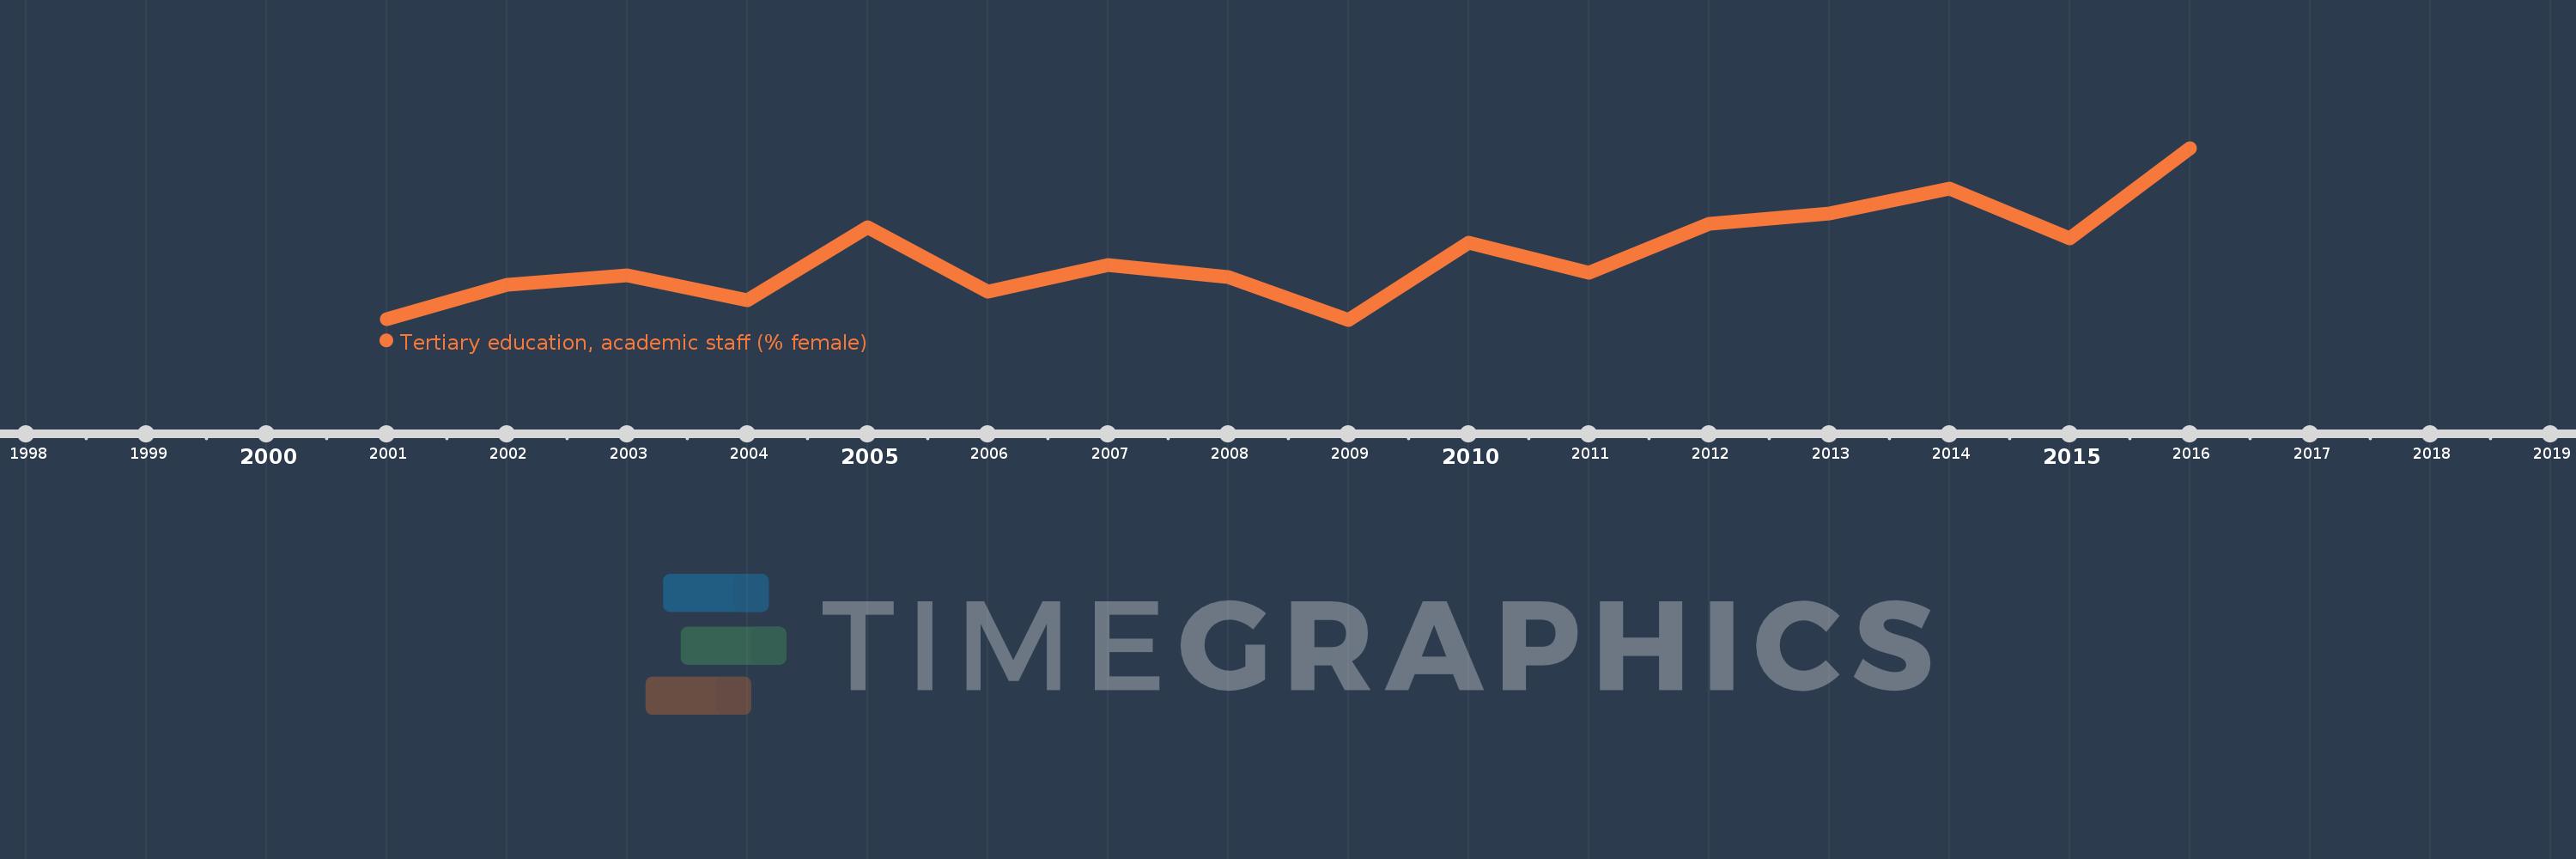
Questa scala temporale mostra un grafico dal 2001 anno al 2016 anno. Tajikistan. I dati fino ad 2000 anno non disponibili. Il numero di osservazioni attuali secondo i date: 16.
La fonte (nome):
Indicatori dello sviluppo mondiale
La fonte (organizzazione):
United Nations Educational, Scientific, and Cultural Organization (UNESCO) Institute for Statistics.
Categorie:
Education
sono stati aggiornati
23 apr 2017 anni
Indicatori delle variazioni dei valori per anni
In media:
34.155
Minima:
31.881
1 gen 2009 anni
Massimo:
37.973
1 gen 2016 anni
Alla data di osservazione
Valore
Variazione assoluta
La variazione rispetto al valore precedente
1 gen 2001 anni
31.896
+31.896
0.0%
1 gen 2002 anni
33.114
+1.218
3.82%
1 gen 2003 anni
33.449
+0.335
1.01%
1 gen 2004 anni
32.574
-0.875
-2.62%
1 gen 2005 anni
35.161
+2.587
7.94%
1 gen 2006 anni
32.866
-2.295
-6.53%
1 gen 2007 anni
33.815
+0.949
2.89%
1 gen 2008 anni
33.389
-0.426
-1.26%
1 gen 2009 anni
31.881
-1.509
-4.52%
1 gen 2010 anni
34.609
+2.728
8.56%
1 gen 2011 anni
33.561
-1.048
-3.03%
1 gen 2012 anni
35.271
+1.711
5.1%
1 gen 2013 anni
35.645
+0.373
1.06%
1 gen 2014 anni
36.519
+0.874
2.45%
1 gen 2015 anni
34.761
-1.758
-4.81%
1 gen 2016 anni
37.973
+3.212
9.24%
Classificazione dei paesi secondo i statistiche attuali per anni