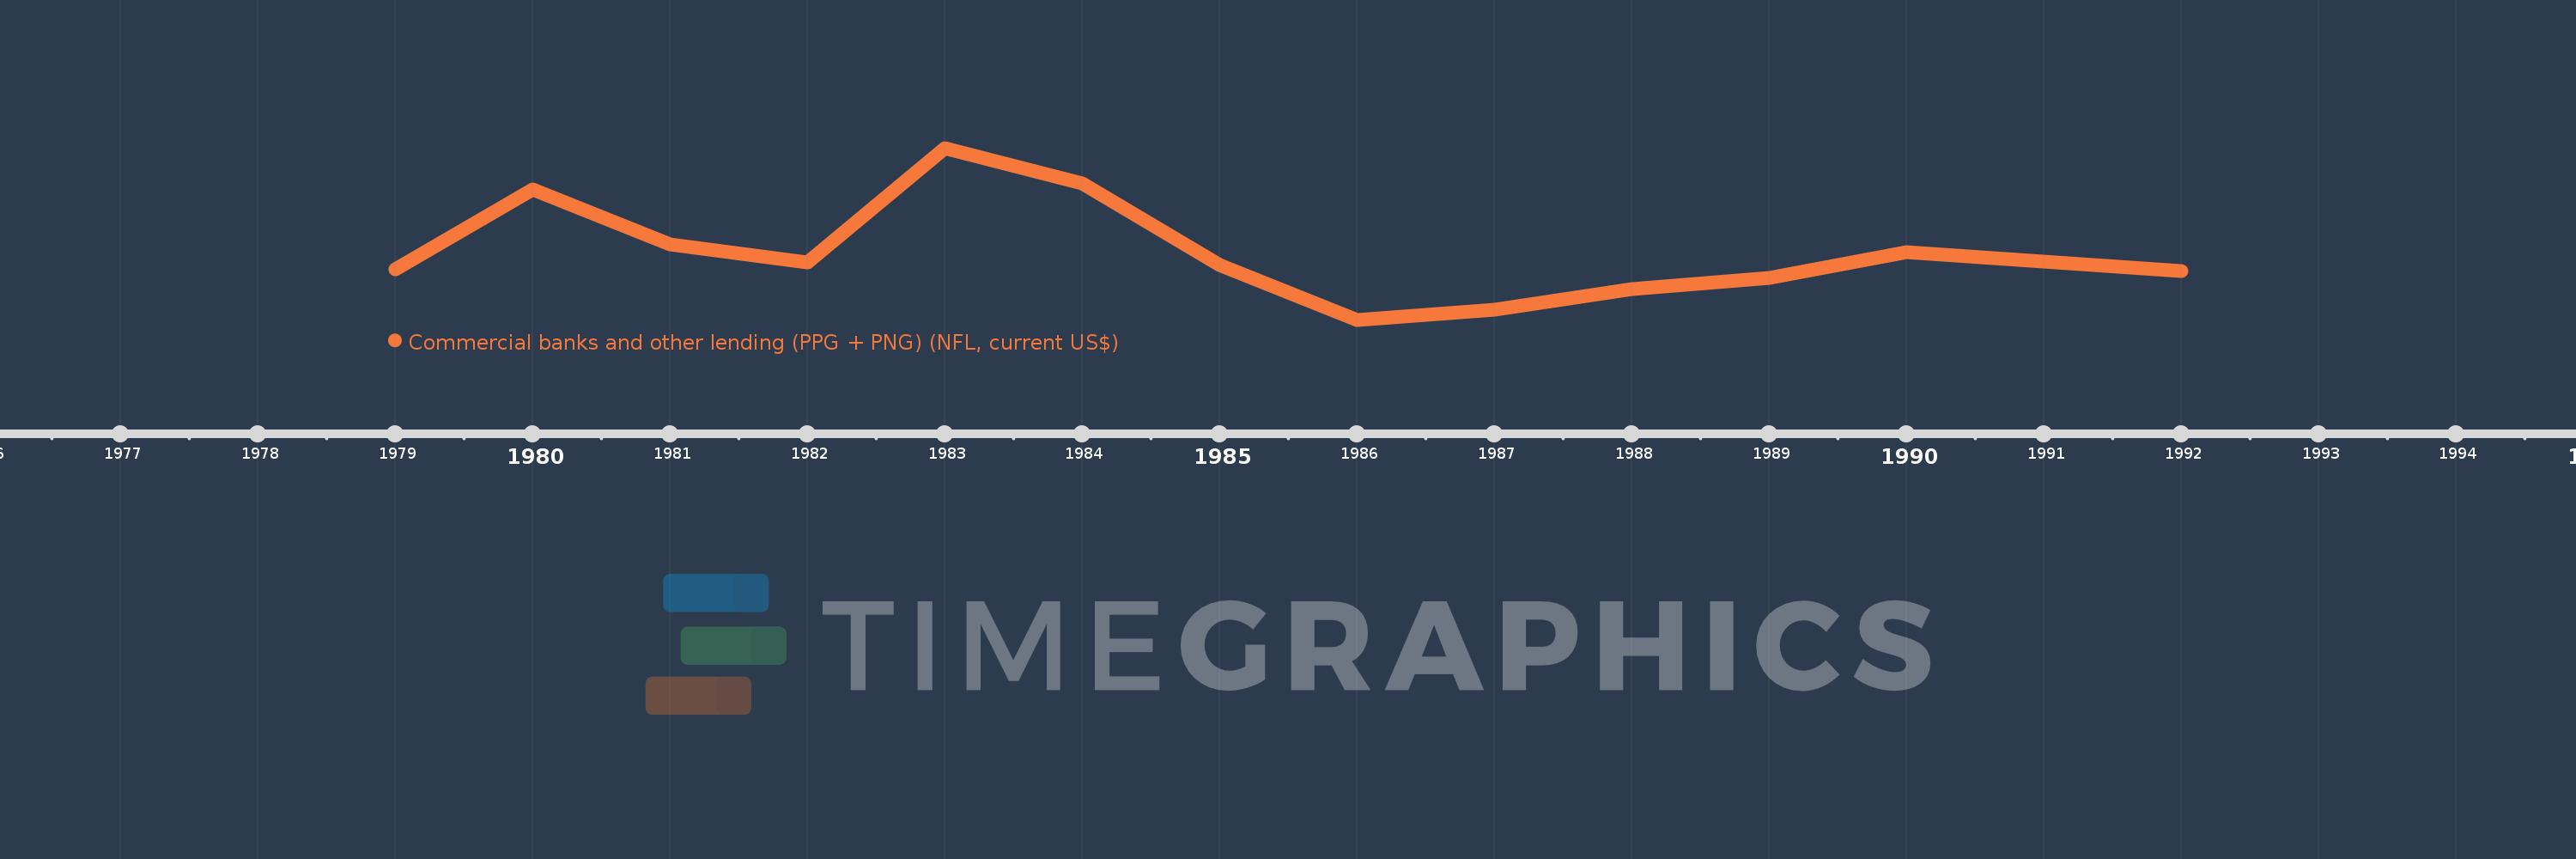
Questa scala temporale mostra un grafico dal 1979 anno al 1992 anno. Burkina Faso. I dati fino ad 1978 anno non disponibili. Il numero di osservazioni attuali secondo i date: 13.
La fonte (nome):
Indicatori dello sviluppo mondiale
La fonte (organizzazione):
World Bank, International Debt Statistics.
Categorie:
External Debt
sono stati aggiornati
23 apr 2017 anni
Indicatori delle variazioni dei valori per anni
In media:
2.552 Mln
Minima:
-9.066 Mln
1 gen 1986 anni
Massimo:
20.642 Mln
1 gen 1983 anni
Alla data di osservazione
Valore
Variazione assoluta
La variazione rispetto al valore precedente
1 gen 1979 anni
-412.0 Mille.
-412.0 Mille.
0.0%
1 gen 1980 anni
13.402 Mln
+13.814 Mln
-3.35 Mille.%
1 gen 1981 anni
3.901 Mln
-9.501 Mln
-70.89%
1 gen 1982 anni
775.0 Mille.
-3.126 Mln
-80.13%
1 gen 1983 anni
20.642 Mln
+19.867 Mln
2.56 Mille.%
1 gen 1984 anni
14.544 Mln
-6.098 Mln
-29.54%
1 gen 1985 anni
350.0 Mille.
-14.194 Mln
-97.59%
1 gen 1986 anni
-9.066 Mln
-9.416 Mln
-2.69 Mille.%
1 gen 1987 anni
-7.294 Mln
+1.772 Mln
-19.55%
1 gen 1988 anni
-3.831 Mln
+3.463 Mln
-47.48%
1 gen 1989 anni
-1.844 Mln
+1.987 Mln
-51.87%
1 gen 1990 anni
2.607 Mln
+4.451 Mln
-241.38%
1 gen 1992 anni
-600.0 Mille.
-3.207 Mln
-123.01%
Classificazione dei paesi secondo i statistiche attuali per anni