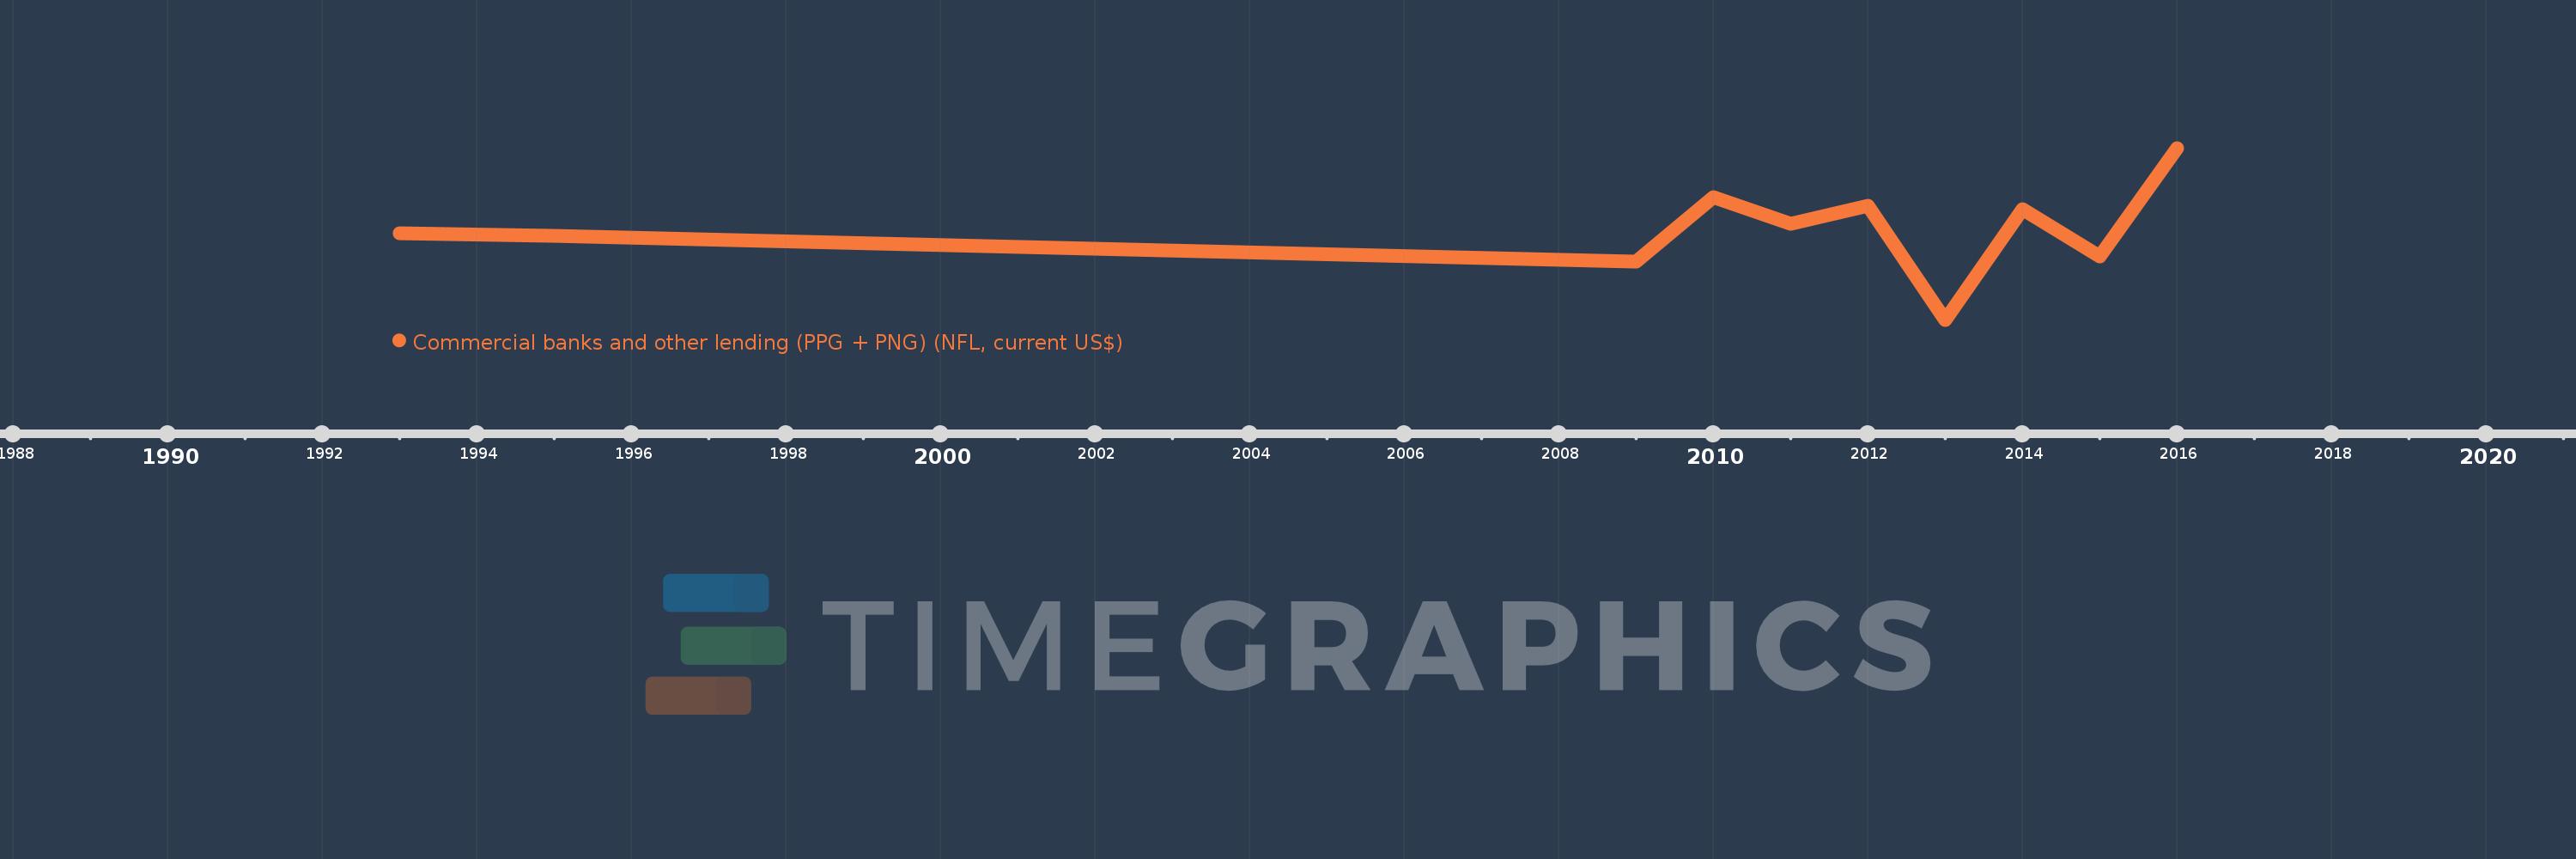
Questa scala temporale mostra un grafico dal 1993 anno al 2016 anno. Georgia. I dati fino ad 1992 anno non disponibili. Il numero di osservazioni attuali secondo i date: 10.
La fonte (nome):
Indicatori dello sviluppo mondiale
La fonte (organizzazione):
World Bank, International Debt Statistics.
Categorie:
External Debt
sono stati aggiornati
23 apr 2017 anni
Indicatori delle variazioni dei valori per anni
In media:
53.814 Mln
Minima:
-691.897 Mln
1 gen 2013 anni
Massimo:
719.409 Mln
1 gen 2016 anni
Alla data di osservazione
Valore
Variazione assoluta
La variazione rispetto al valore precedente
1 gen 1993 anni
21.45 Mln
+21.45 Mln
0.0%
1 gen 1995 anni
-926.0 Mille.
-22.376 Mln
-104.32%
1 gen 2009 anni
-215.089 Mln
-214.163 Mln
23.13 Mille.%
1 gen 2010 anni
316.398 Mln
+531.487 Mln
-247.1%
1 gen 2011 anni
99.682 Mln
-216.716 Mln
-68.49%
1 gen 2012 anni
245.33 Mln
+145.648 Mln
146.11%
1 gen 2013 anni
-691.897 Mln
-937.227 Mln
-382.03%
1 gen 2014 anni
219.097 Mln
+910.994 Mln
-131.67%
1 gen 2015 anni
-175.313 Mln
-394.41 Mln
-180.02%
1 gen 2016 anni
719.409 Mln
+894.722 Mln
-510.36%
Classificazione dei paesi secondo i statistiche attuali per anni