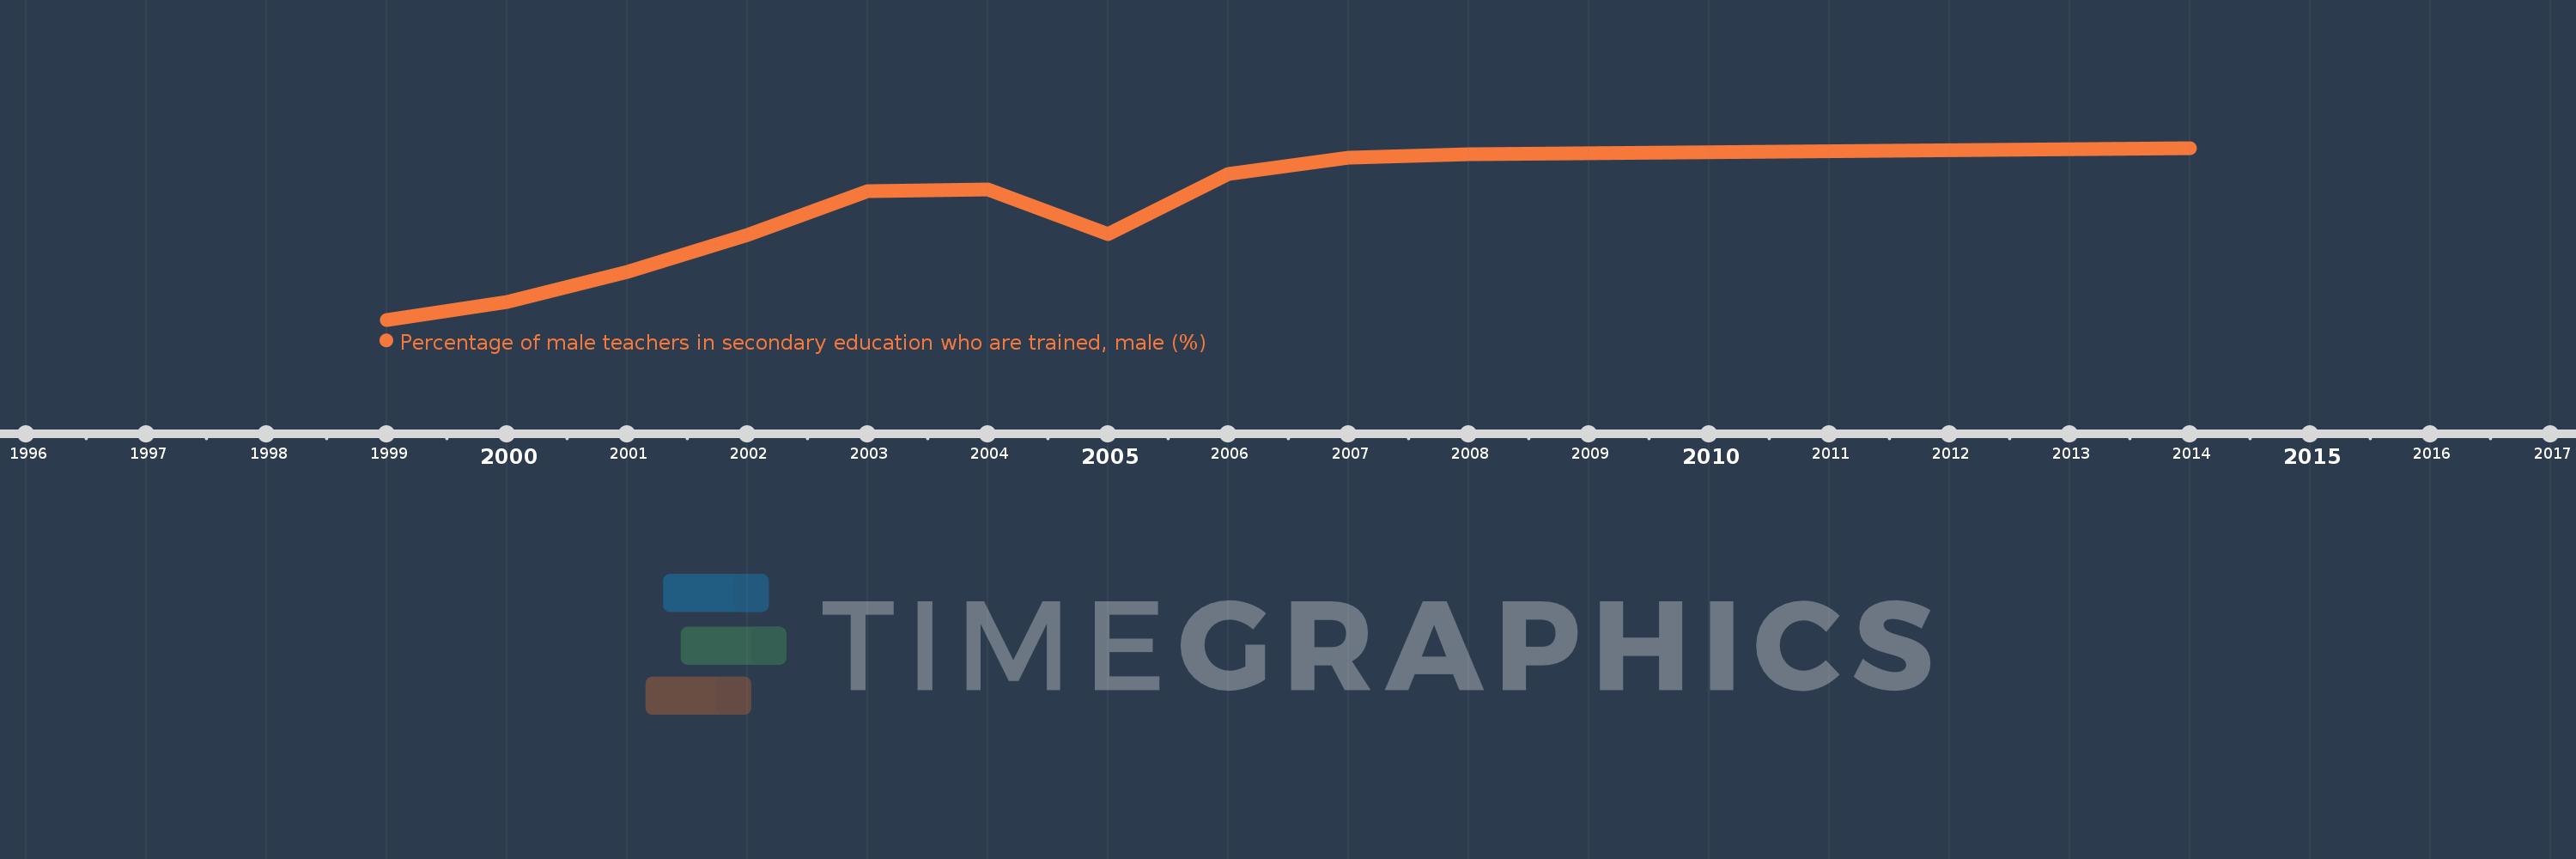
Questa scala temporale mostra un grafico dal 1999 anno al 2014 anno. Botswana. I dati fino ad 1998 anno non disponibili. Il numero di osservazioni attuali secondo i date: 11.
La fonte (nome):
Indicatori dello sviluppo mondiale
La fonte (organizzazione):
UNESCO Institute for Statistics
Categorie:
Education
sono stati aggiornati
23 apr 2017 anni
Indicatori delle variazioni dei valori per anni
In media:
93.517
Minima:
84.184
1 gen 1999 anni
Massimo:
99.643
1 gen 2014 anni
Alla data di osservazione
Valore
Variazione assoluta
La variazione rispetto al valore precedente
1 gen 1999 anni
84.184
+84.184
0.0%
1 gen 2000 anni
85.75
+1.567
1.86%
1 gen 2001 anni
88.504
+2.753
3.21%
1 gen 2002 anni
91.784
+3.28
3.71%
1 gen 2003 anni
95.779
+3.996
4.35%
1 gen 2004 anni
95.91
+0.131
0.14%
1 gen 2005 anni
91.896
-4.013
-4.18%
1 gen 2006 anni
97.326
+5.429
5.91%
1 gen 2007 anni
98.8
+1.474
1.51%
1 gen 2008 anni
99.111
+0.312
0.32%
1 gen 2014 anni
99.643
+0.532
0.54%
Classificazione dei paesi secondo i statistiche attuali per anni