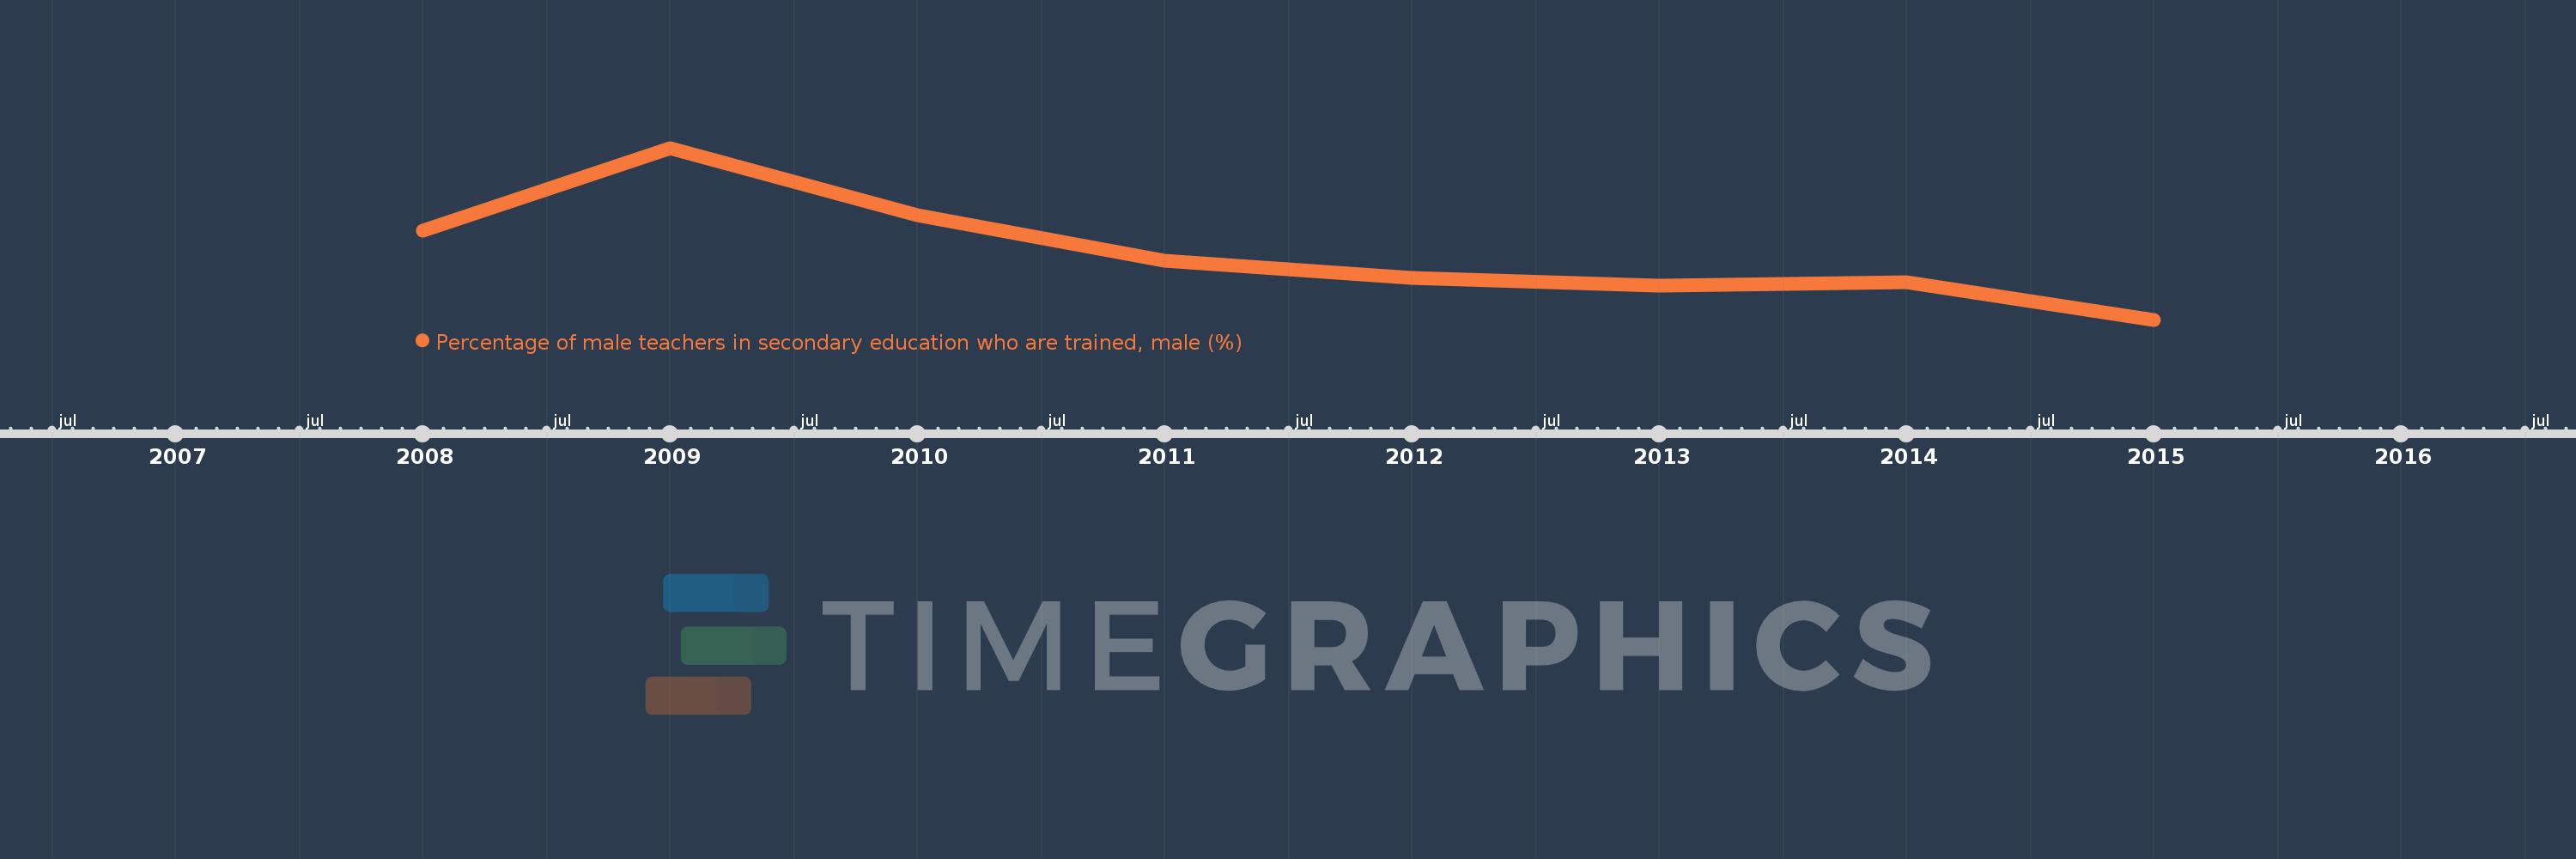
Questa scala temporale mostra un grafico dal 2008 anno al 2015 anno. Sub-Saharan Africa . I dati fino ad 2007 anno non disponibili. Il numero di osservazioni attuali secondo i date: 8.
La fonte (nome):
Indicatori dello sviluppo mondiale
La fonte (organizzazione):
UNESCO Institute for Statistics
Categorie:
Education
sono stati aggiornati
23 apr 2017 anni
Indicatori delle variazioni dei valori per anni
In media:
58.121
Minima:
52.612
1 gen 2015 anni
Massimo:
66.676
1 gen 2009 anni
Alla data di osservazione
Valore
Variazione assoluta
La variazione rispetto al valore precedente
1 gen 2008 anni
59.874
+59.874
0.0%
1 gen 2009 anni
66.676
+6.802
11.36%
1 gen 2010 anni
61.179
-5.497
-8.24%
1 gen 2011 anni
57.451
-3.728
-6.09%
1 gen 2012 anni
56.051
-1.4
-2.44%
1 gen 2013 anni
55.437
-0.614
-1.09%
1 gen 2014 anni
55.691
+0.253
0.46%
1 gen 2015 anni
52.612
-3.079
-5.53%
Classificazione dei paesi secondo i statistiche attuali per anni