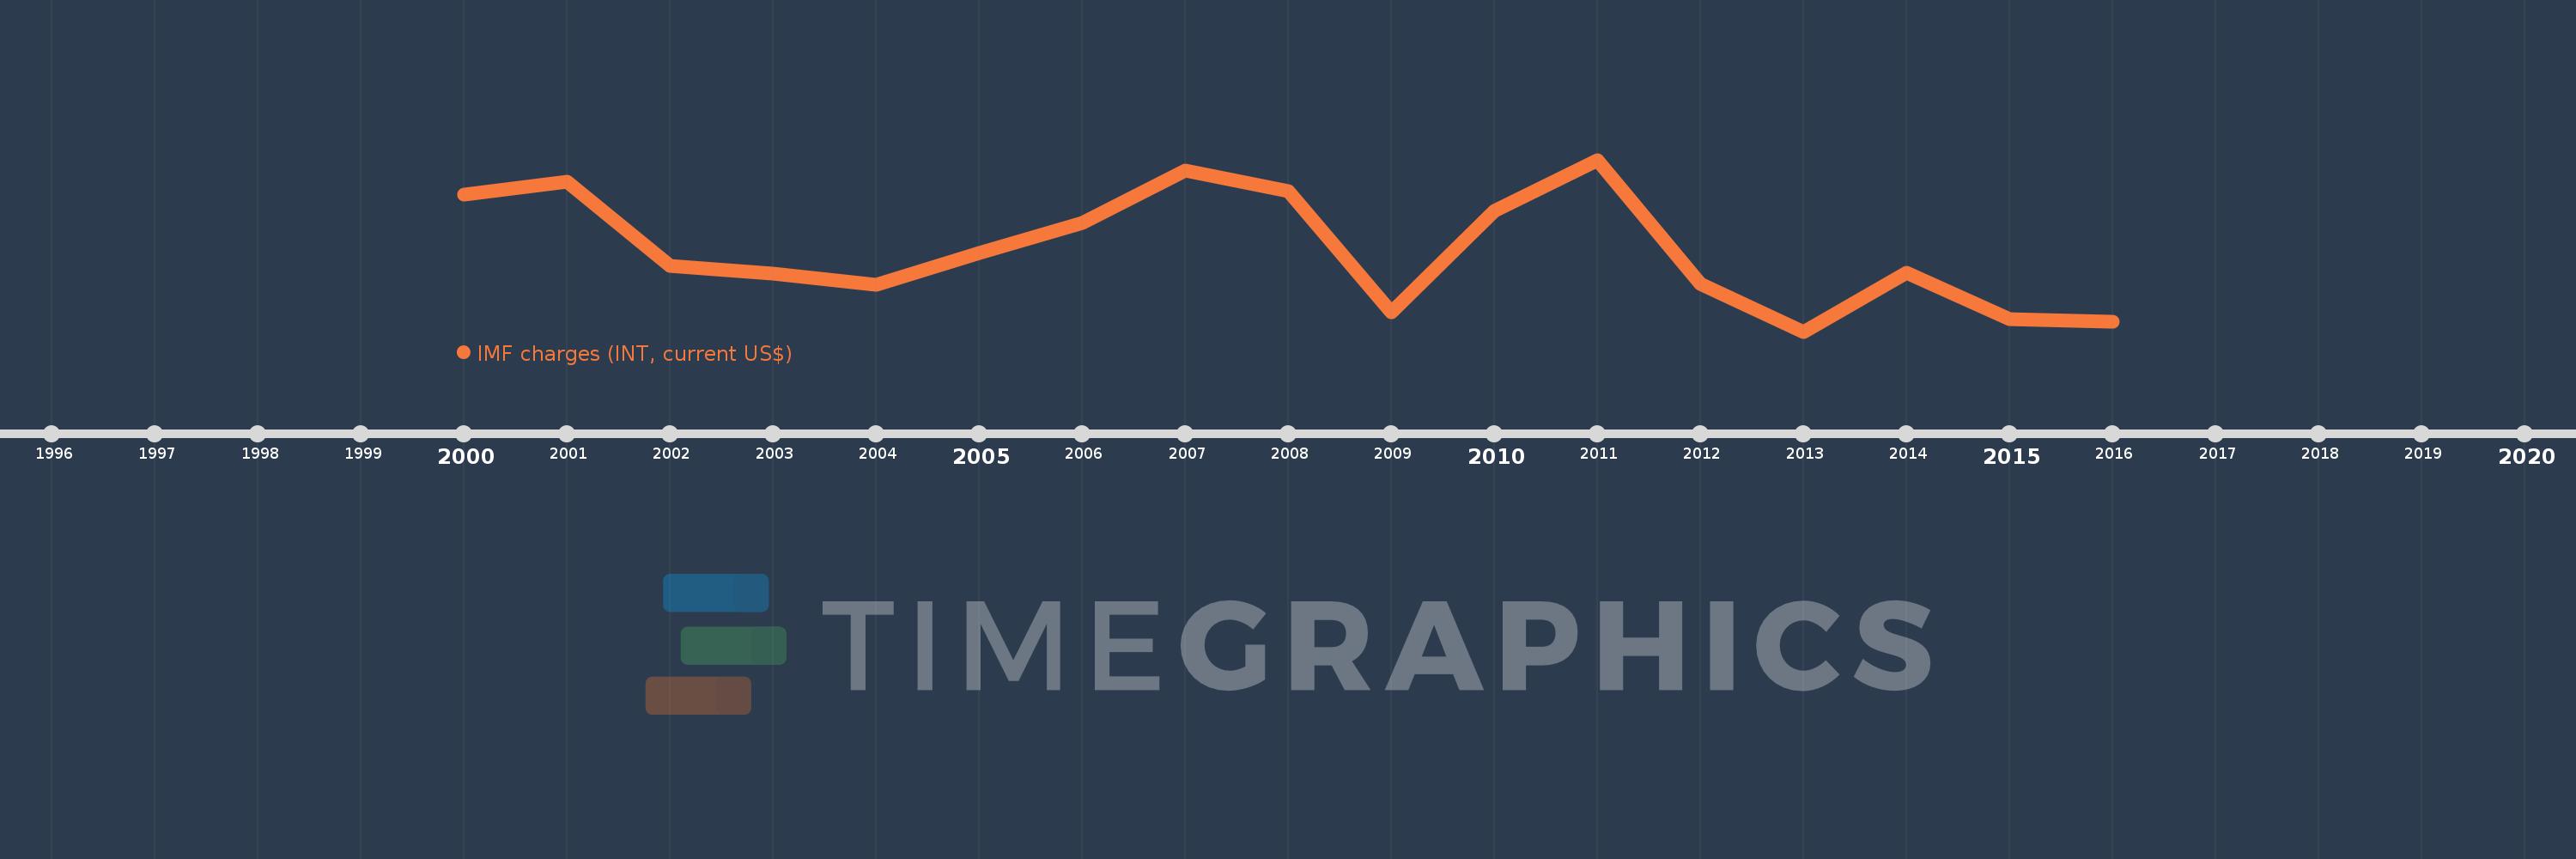
Questa scala temporale mostra un grafico dal 2000 anno al 2016 anno. Botswana. I dati fino ad 1999 anno non disponibili. Il numero di osservazioni attuali secondo i date: 17.
La fonte (nome):
Indicatori dello sviluppo mondiale
La fonte (organizzazione):
World Bank, International Debt Statistics.
Categorie:
External Debt
sono stati aggiornati
23 apr 2017 anni
Indicatori delle variazioni dei valori per anni
In media:
148.0 Mille.
Minima:
26.0 Mille.
1 gen 2013 anni
Massimo:
283.0 Mille.
1 gen 2011 anni
Alla data di osservazione
Valore
Variazione assoluta
La variazione rispetto al valore precedente
1 gen 2000 anni
231.0 Mille.
+231.0 Mille.
0.0%
1 gen 2001 anni
250.0 Mille.
+19.0 Mille.
8.23%
1 gen 2002 anni
124.0 Mille.
-126.0 Mille.
-50.4%
1 gen 2003 anni
113.0 Mille.
-11.0 Mille.
-8.87%
1 gen 2004 anni
96.0 Mille.
-17.0 Mille.
-15.04%
1 gen 2005 anni
143.0 Mille.
+47.0 Mille.
48.96%
1 gen 2006 anni
189.0 Mille.
+46.0 Mille.
32.17%
1 gen 2007 anni
267.0 Mille.
+78.0 Mille.
41.27%
1 gen 2008 anni
236.0 Mille.
-31.0 Mille.
-11.61%
1 gen 2009 anni
55.0 Mille.
-181.0 Mille.
-76.69%
1 gen 2010 anni
207.0 Mille.
+152.0 Mille.
276.36%
1 gen 2011 anni
283.0 Mille.
+76.0 Mille.
36.71%
1 gen 2012 anni
97.0 Mille.
-186.0 Mille.
-65.72%
1 gen 2013 anni
26.0 Mille.
-71.0 Mille.
-73.2%
1 gen 2014 anni
114.0 Mille.
+88.0 Mille.
338.46%
1 gen 2015 anni
44.0 Mille.
-70.0 Mille.
-61.4%
1 gen 2016 anni
41.0 Mille.
-3.0 Mille.
-6.82%
Classificazione dei paesi secondo i statistiche attuali per anni