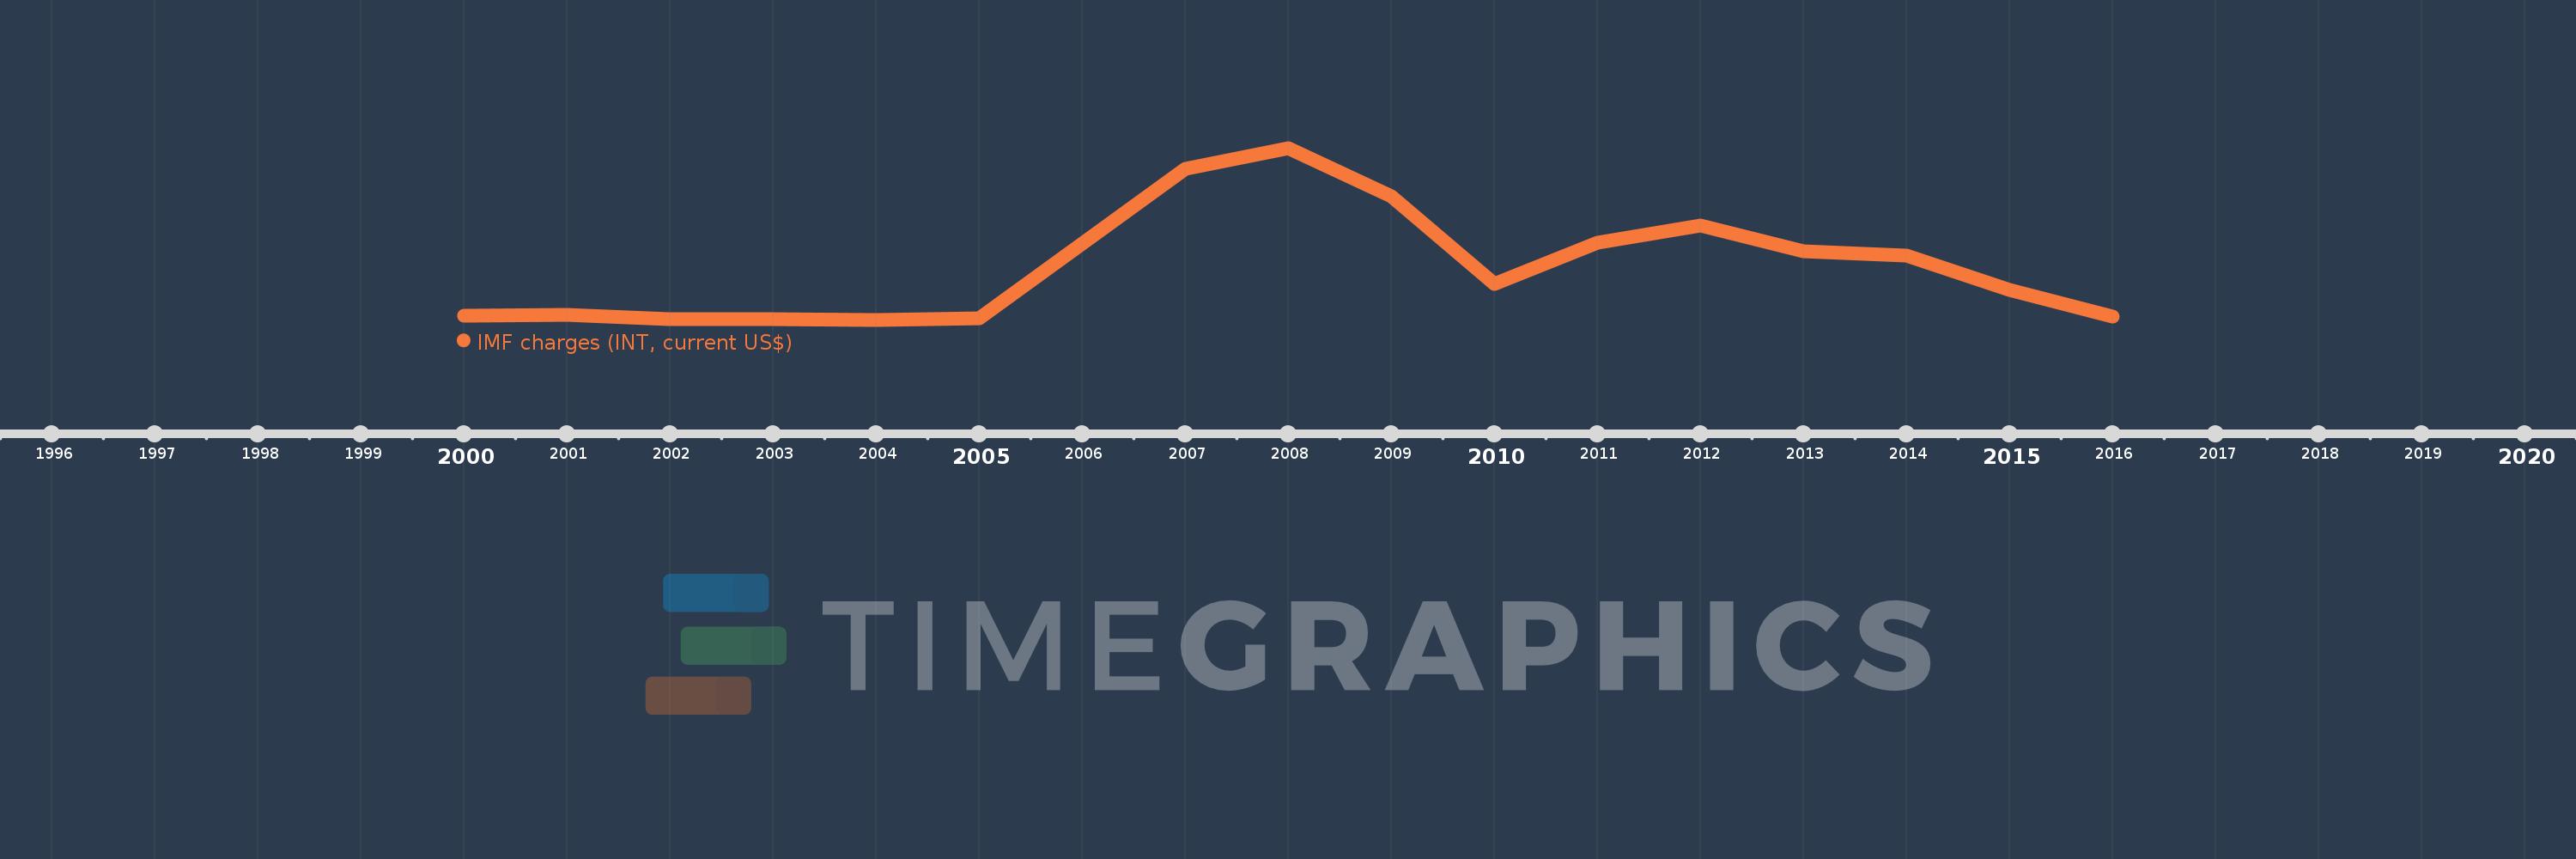
Questa scala temporale mostra un grafico dal 2000 anno al 2016 anno. Maldives. I dati fino ad 1999 anno non disponibili. Il numero di osservazioni attuali secondo i date: 17.
La fonte (nome):
Indicatori dello sviluppo mondiale
La fonte (organizzazione):
World Bank, International Debt Statistics.
Categorie:
External Debt
sono stati aggiornati
23 apr 2017 anni
Indicatori delle variazioni dei valori per anni
In media:
113.941 Mille.
Minima:
6.0 Mille.
1 gen 2004 anni
Massimo:
353.0 Mille.
1 gen 2008 anni
Alla data di osservazione
Valore
Variazione assoluta
La variazione rispetto al valore precedente
1 gen 2000 anni
15.0 Mille.
+15.0 Mille.
0.0%
1 gen 2001 anni
16.0 Mille.
+1000.0
6.67%
1 gen 2002 anni
8.0 Mille.
-8.0 Mille.
-50.0%
1 gen 2003 anni
7.0 Mille.
-1000.0
-12.5%
1 gen 2004 anni
6.0 Mille.
-1000.0
-14.29%
1 gen 2005 anni
9.0 Mille.
+3.0 Mille.
50.0%
1 gen 2006 anni
160.0 Mille.
+151.0 Mille.
1.68 Mille.%
1 gen 2007 anni
310.0 Mille.
+150.0 Mille.
93.75%
1 gen 2008 anni
353.0 Mille.
+43.0 Mille.
13.87%
1 gen 2009 anni
255.0 Mille.
-98.0 Mille.
-27.76%
1 gen 2010 anni
79.0 Mille.
-176.0 Mille.
-69.02%
1 gen 2011 anni
162.0 Mille.
+83.0 Mille.
105.06%
1 gen 2012 anni
197.0 Mille.
+35.0 Mille.
21.6%
1 gen 2013 anni
145.0 Mille.
-52.0 Mille.
-26.4%
1 gen 2014 anni
136.0 Mille.
-9.0 Mille.
-6.21%
1 gen 2015 anni
67.0 Mille.
-69.0 Mille.
-50.74%
1 gen 2016 anni
12.0 Mille.
-55.0 Mille.
-82.09%
Classificazione dei paesi secondo i statistiche attuali per anni