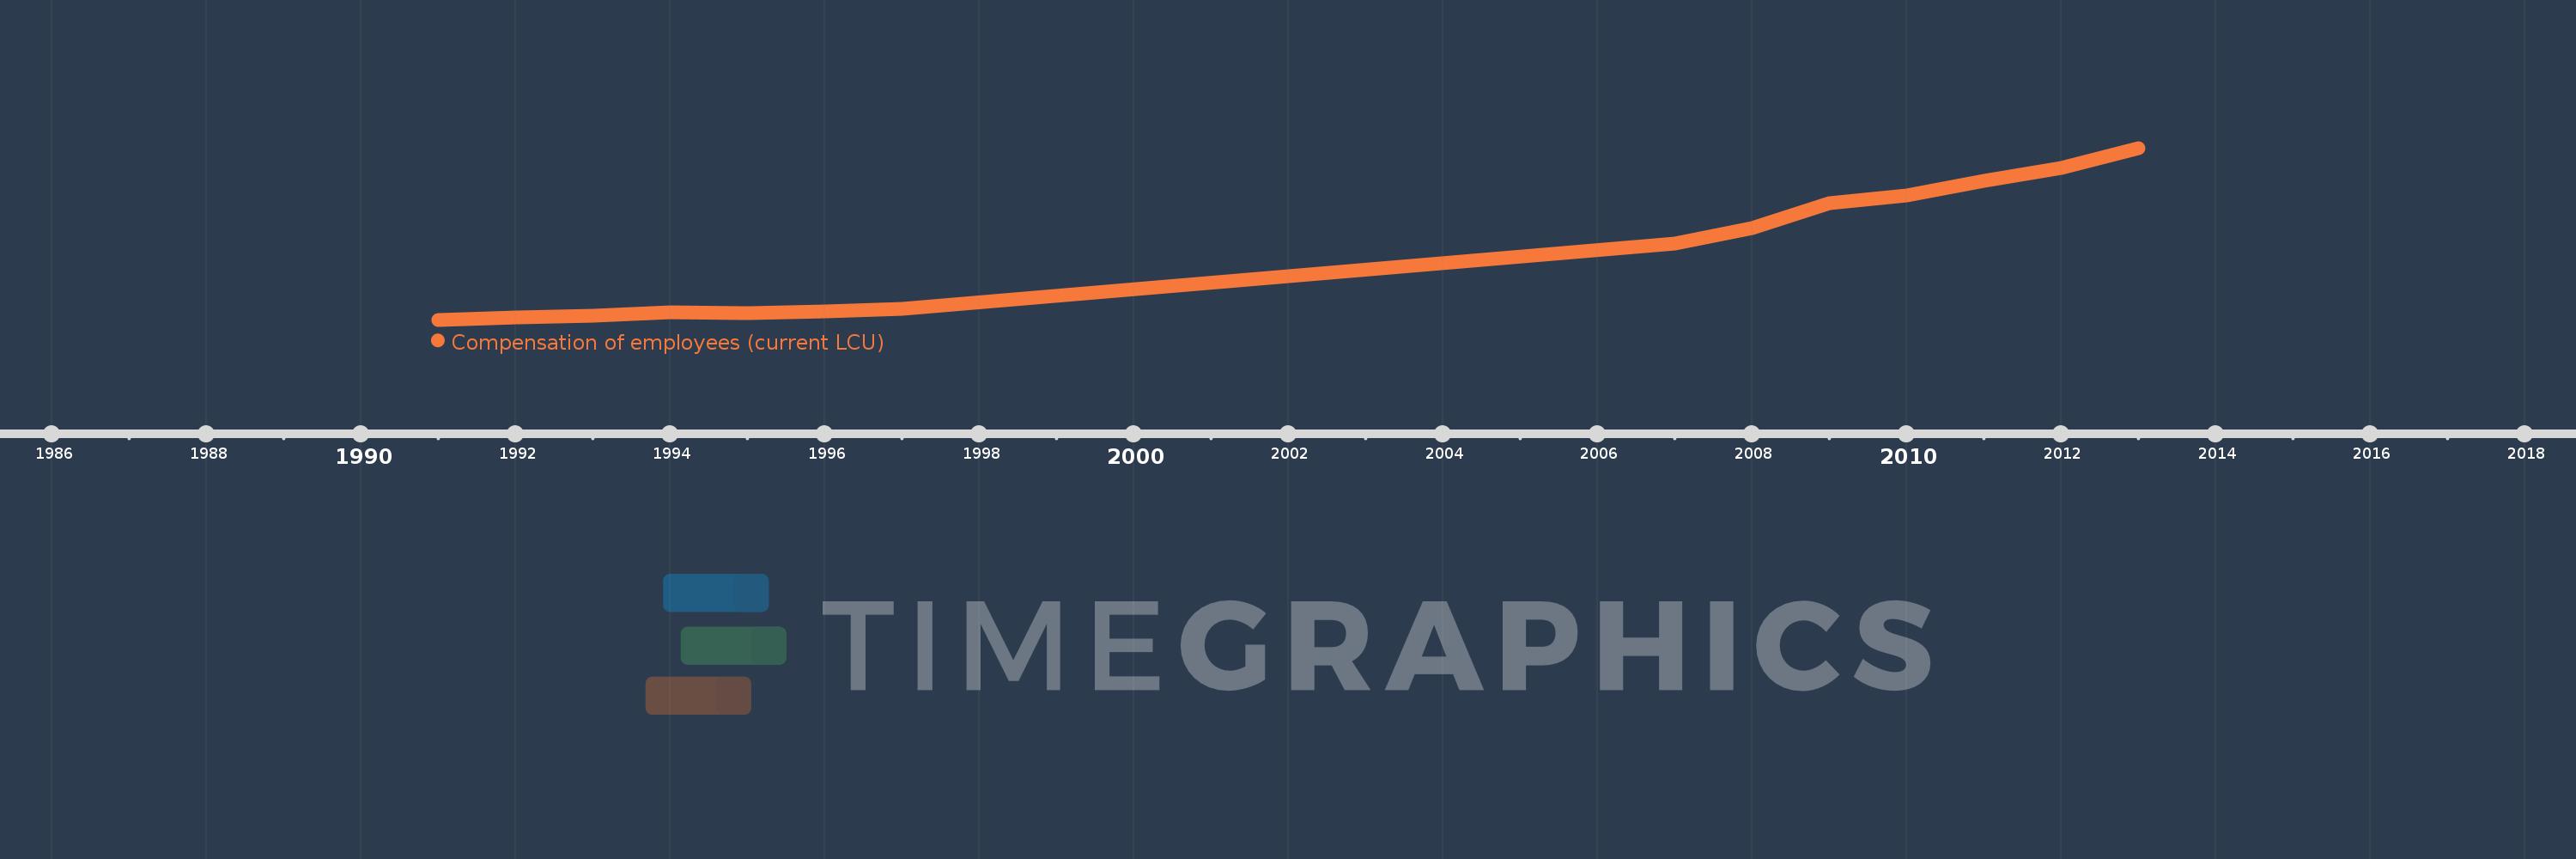
Questa scala temporale mostra un grafico dal 1991 anno al 2013 anno. Botswana. I dati fino ad 1990 anno non disponibili. Il numero di osservazioni attuali secondo i date: 14.
La fonte (nome):
Indicatori dello sviluppo mondiale
La fonte (organizzazione):
International Monetary Fund, Government Finance Statistics Yearbook and data files.
Categorie:
Public Sector
sono stati aggiornati
23 apr 2017 anni
Indicatori delle variazioni dei valori per anni
In media:
5.856 Mlrd
Minima:
547.11 Mln
1 gen 1991 anni
Massimo:
14.548 Mlrd
1 gen 2013 anni
Alla data di osservazione
Valore
Variazione assoluta
La variazione rispetto al valore precedente
1 gen 1991 anni
547.11 Mln
+547.11 Mln
0.0%
1 gen 1992 anni
738.9 Mln
+191.79 Mln
35.06%
1 gen 1993 anni
908.5 Mln
+169.6 Mln
22.95%
1 gen 1994 anni
1.134 Mlrd
+225.1 Mln
24.78%
1 gen 1995 anni
1.083 Mlrd
-50.7 Mln
-4.47%
1 gen 1996 anni
1.224 Mlrd
+141.4 Mln
13.06%
1 gen 1997 anni
1.444 Mlrd
+220.2 Mln
17.99%
1 gen 2007 anni
6.777 Mlrd
+5.333 Mlrd
369.18%
1 gen 2008 anni
7.99 Mlrd
+1.213 Mlrd
17.9%
1 gen 2009 anni
10.066 Mlrd
+2.076 Mlrd
25.98%
1 gen 2010 anni
10.683 Mlrd
+616.7 Mln
6.13%
1 gen 2011 anni
11.899 Mlrd
+1.216 Mlrd
11.39%
1 gen 2012 anni
12.941 Mlrd
+1.042 Mlrd
8.75%
1 gen 2013 anni
14.548 Mlrd
+1.607 Mlrd
12.42%
Classificazione dei paesi secondo i statistiche attuali per anni