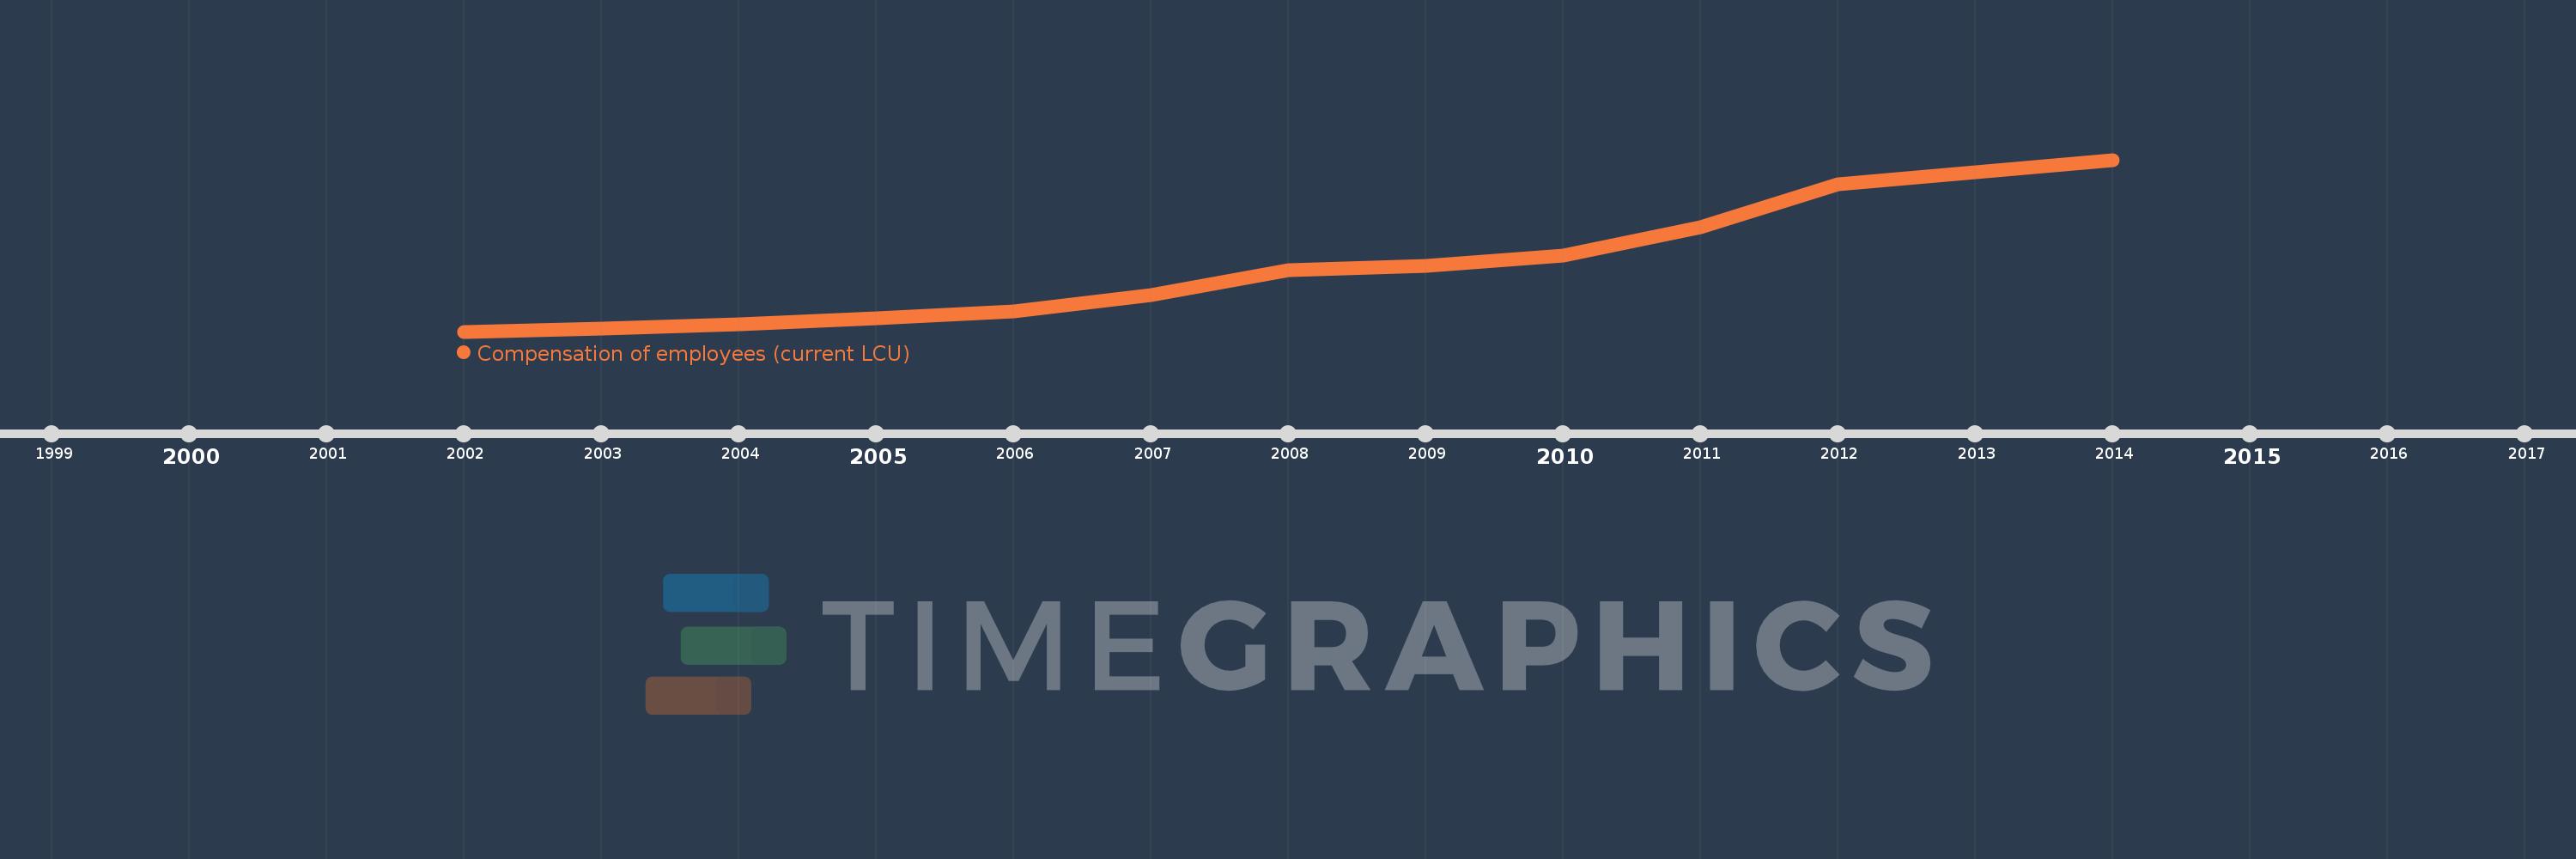
Questa scala temporale mostra un grafico dal 2002 anno al 2014 anno. Bangladesh. I dati fino ad 2001 anno non disponibili. Il numero di osservazioni attuali secondo i date: 13.
La fonte (nome):
Indicatori dello sviluppo mondiale
La fonte (organizzazione):
International Monetary Fund, Government Finance Statistics Yearbook and data files.
Categorie:
Public Sector
sono stati aggiornati
23 apr 2017 anni
Indicatori delle variazioni dei valori per anni
In media:
123.014 Mlrd
Minima:
62.318 Mlrd
1 gen 2002 anni
Massimo:
218.807 Mlrd
1 gen 2014 anni
Alla data di osservazione
Valore
Variazione assoluta
La variazione rispetto al valore precedente
1 gen 2002 anni
62.318 Mlrd
+62.318 Mlrd
0.0%
1 gen 2003 anni
65.394 Mlrd
+3.076 Mlrd
4.94%
1 gen 2004 anni
69.137 Mlrd
+3.743 Mlrd
5.72%
1 gen 2005 anni
74.314 Mlrd
+5.177 Mlrd
7.49%
1 gen 2006 anni
80.729 Mlrd
+6.415 Mlrd
8.63%
1 gen 2007 anni
95.703 Mlrd
+14.974 Mlrd
18.55%
1 gen 2008 anni
118.302 Mlrd
+22.599 Mlrd
23.61%
1 gen 2009 anni
122.159 Mlrd
+3.858 Mlrd
3.26%
1 gen 2010 anni
131.685 Mlrd
+9.525 Mlrd
7.8%
1 gen 2011 anni
157.142 Mlrd
+25.457 Mlrd
19.33%
1 gen 2012 anni
196.28 Mlrd
+39.139 Mlrd
24.91%
1 gen 2013 anni
207.215 Mlrd
+10.935 Mlrd
5.57%
1 gen 2014 anni
218.807 Mlrd
+11.592 Mlrd
5.59%
Classificazione dei paesi secondo i statistiche attuali per anni