29
/it/
it
AIzaSyAYiBZKx7MnpbEhh9jyipgxe19OcubqV5w
April 1, 2024
88876
Bosnia and Herzegovina
BIH
true
2
1
Net bilateral aid flows from DAC donors, Ireland (current US$)
2014,2013,2012,2011,2010,2009,2008,2007,2006,2005,2004,2003,2002,2001,2000,1999,1998,1997
Download
Biblioteca di statistiche globali →Bosnia and Herzegovina →

Net bilateral aid flows from DAC donors, Ireland (current US$)

Queste statistiche in altri paesi:
AfghanistanAlbaniaAlgeriaAngolaArab WorldArgentinaArmeniaAzerbaijanBangladeshBelarusBelizeBeninBhutanBoliviaBosnia and HerzegovinaBotswanaBrazilBulgariaBurkina FasoBurundiCambodiaCameroonCaribbean small statesCentral African RepublicCentral Europe and the BalticsChadChileChinaColombiaComorosCongo, Dem. Rep.Congo, Rep.Costa RicaCote d'IvoireCroatiaCubaCzech RepublicDjiboutiDominican RepublicEast Asia & PacificEast Asia & Pacific (excluding high income)East Asia & Pacific (IDA & IBRD countries)EcuadorEgypt, Arab Rep.El SalvadorEquatorial GuineaEritreaEthiopiaEuro areaEurope & Central AsiaEurope & Central Asia (excluding high income)Europe & Central Asia (IDA & IBRD countries)European UnionFijiFragile and conflict affected situationsGabonGambia, TheGeorgiaGhanaGrenadaGuatemalaGuineaGuinea-BissauGuyanaHaitiHeavily indebted poor countries (HIPC)High incomeHondurasHong Kong SAR, ChinaHungaryIBRD onlyIDA & IBRD totalIDA blendIDA onlyIDA totalIndiaIndonesiaIran, Islamic Rep.IraqIsraelJamaicaJordanKazakhstanKenyaKorea, Dem. People’s Rep.Korea, Rep.KosovoKyrgyz RepublicLao PDRLatin America & Caribbean Latin America & Caribbean (excluding high income)Latin America & the Caribbean (IDA & IBRD countries)LatviaLeast developed countries: UN classificationLebanonLesothoLiberiaLibyaLithuaniaLow & middle incomeLow incomeLower middle incomeMacedonia, FYRMadagascarMalawiMalaysiaMaldivesMaliMauritaniaMauritiusMexicoMicronesia, Fed. Sts.Middle East & North AfricaMiddle East & North Africa (excluding high income)Middle East & North Africa (IDA & IBRD countries)Middle incomeMoldovaMongoliaMontenegroMoroccoMozambiqueMyanmarNamibiaNepalNicaraguaNigerNigeriaOECD membersOther small statesPacific island small statesPakistanPanamaPapua New GuineaParaguayPeruPhilippinesPolandRomaniaRussian FederationRwandaSamoaSao Tome and PrincipeSenegalSerbiaSeychellesSierra LeoneSlovak RepublicSloveniaSmall statesSolomon IslandsSomaliaSouth AfricaSouth AsiaSouth Asia (IDA & IBRD)South SudanSri LankaSt. LuciaSub-Saharan Africa Sub-Saharan Africa (excluding high income)Sub-Saharan Africa (IDA & IBRD countries)SudanSurinameSwazilandSyrian Arab RepublicTajikistanTanzaniaThailandTimor-LesteTogoTrinidad and TobagoTunisiaTurkeyTurkmenistanUgandaUkraineUpper middle incomeUruguayUzbekistanVanuatuVenezuela, RBVietnamWest Bank and GazaWorldYemen, Rep.ZambiaZimbabwe
Linea del tempo:
Questa scala temporale mostra un grafico dal 1997 anno al 2014 anno. Bosnia and Herzegovina. I dati fino ad 1996 anno non disponibili. Il numero di osservazioni attuali secondo i date: 18.
La fonte (nome):
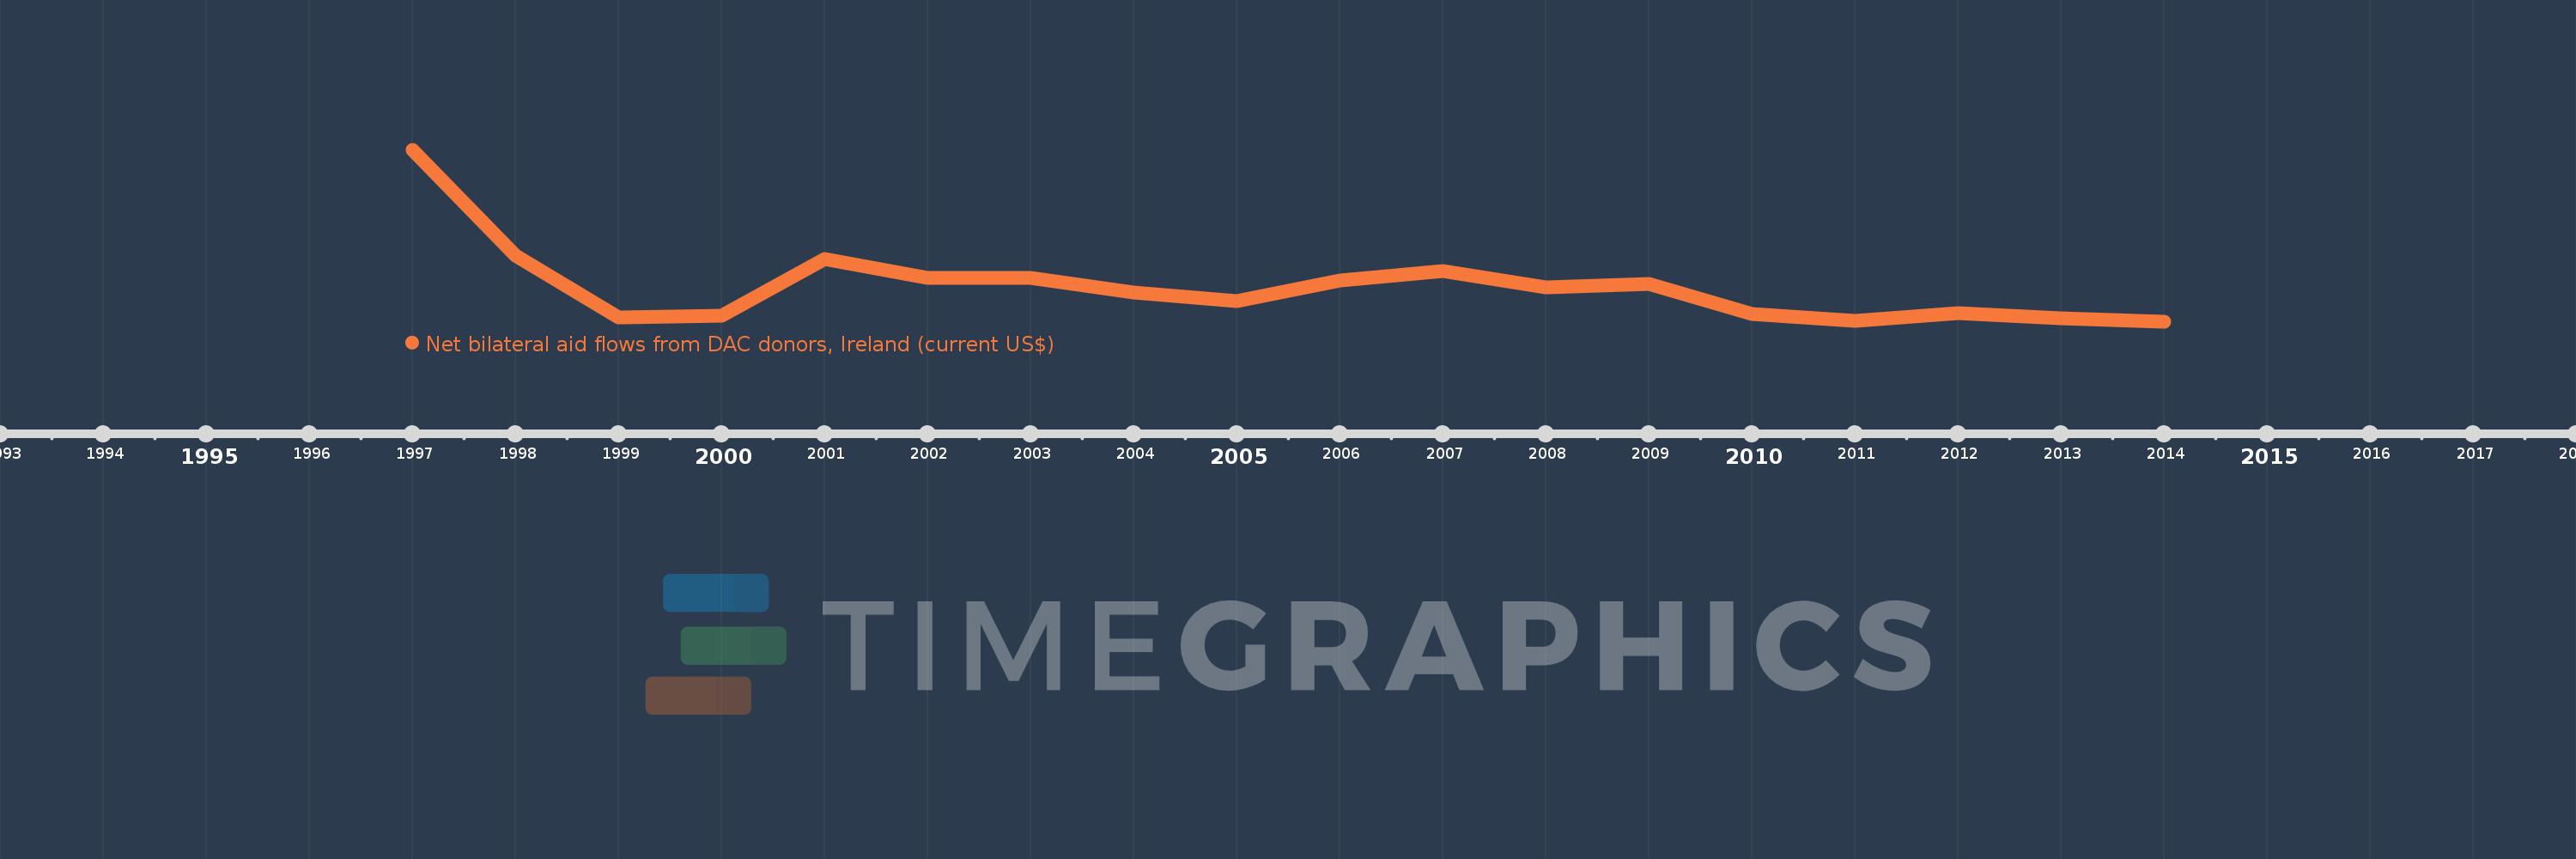
Indicatori dello sviluppo mondiale
La fonte (organizzazione):
Development Assistance Committee of the Organisation for Economic Co-operation and Development, Geographical Distribution of Financial Flows to Developing Countries, Development Co-operation Report, and International Development Statistics database. Data are available online at: www.oecd.org/dac/stats/idsonline.
Categorie:
Aid Effectiveness
sono stati aggiornati
23 apr 2017 anni
Indicatori delle variazioni dei valori per anni
In media:
1.24 Mln
Minima:
30.0 Mille.
1 gen 2014 anni
Massimo:
5.91 Mln
1 gen 1997 anni
Alla data di osservazione
Valore
Variazione assoluta
La variazione rispetto al valore precedente
1 gen 1997 anni
5.91 Mln
+5.91 Mln
0.0%
1 gen 1998 anni
2.29 Mln
-3.62 Mln
-61.25%
1 gen 1999 anni
180.0 Mille.
-2.11 Mln
-92.14%
1 gen 2000 anni
240.0 Mille.
+60.0 Mille.
33.33%
1 gen 2001 anni
2.18 Mln
+1.94 Mln
808.33%
1 gen 2002 anni
1.54 Mln
-640.0 Mille.
-29.36%
1 gen 2003 anni
1.55 Mln
+10.0 Mille.
0.65%
1 gen 2004 anni
1.05 Mln
-500.0 Mille.
-32.26%
1 gen 2005 anni
740.0 Mille.
-310.0 Mille.
-29.52%
1 gen 2006 anni
1.46 Mln
+720.0 Mille.
97.3%
1 gen 2007 anni
1.76 Mln
+300.0 Mille.
20.55%
1 gen 2008 anni
1.22 Mln
-540.0 Mille.
-30.68%
1 gen 2009 anni
1.33 Mln
+110.0 Mille.
9.02%
1 gen 2010 anni
290.0 Mille.
-1.04 Mln
-78.2%
1 gen 2011 anni
60.0 Mille.
-230.0 Mille.
-79.31%
1 gen 2012 anni
340.0 Mille.
+280.0 Mille.
466.67%
1 gen 2013 anni
150.0 Mille.
-190.0 Mille.
-55.88%
1 gen 2014 anni
30.0 Mille.
-120.0 Mille.
-80.0%
Classificazione dei paesi secondo i statistiche attuali per anni

Commenti:

Inviare
PremiumAbout & FeedbackAccordoPrivatezza
logo
© 2022 Selected Technologies LLC – Morgan Hill, California