33
/it/
AIzaSyAYiBZKx7MnpbEhh9jyipgxe19OcubqV5w
August 1, 2025
190568
Mali
MLI
true
2
1
Net bilateral aid flows from DAC donors, Ireland (current US$)
2015,2014,2013,2011,2009,2008,2007,2006,2005,2004,2000,1999,1998,1997,1996,1989,1988
Download
Biblioteca di statistiche globali →Mali →

Net bilateral aid flows from DAC donors, Ireland (current US$)

Queste statistiche in altri paesi:

AfghanistanAlbaniaAlgeriaAngolaArab WorldArgentinaArmeniaAzerbaijanBangladeshBelarusBelizeBeninBhutanBoliviaBosnia and HerzegovinaBotswanaBrazilBulgariaBurkina FasoBurundiCambodiaCameroonCaribbean small statesCentral African RepublicCentral Europe and the BalticsChadChileChinaColombiaComorosCongo, Dem. Rep.Congo, Rep.Costa RicaCote d'IvoireCroatiaCubaCzech RepublicDjiboutiDominican RepublicEast Asia & PacificEast Asia & Pacific (excluding high income)East Asia & Pacific (IDA & IBRD countries)EcuadorEgypt, Arab Rep.El SalvadorEquatorial GuineaEritreaEthiopiaEuro areaEurope & Central AsiaEurope & Central Asia (excluding high income)Europe & Central Asia (IDA & IBRD countries)European UnionFijiFragile and conflict affected situationsGabonGambia, TheGeorgiaGhanaGrenadaGuatemalaGuineaGuinea-BissauGuyanaHaitiHeavily indebted poor countries (HIPC)High incomeHondurasHong Kong SAR, ChinaHungaryIBRD onlyIDA & IBRD totalIDA blendIDA onlyIDA totalIndiaIndonesiaIran, Islamic Rep.IraqIsraelJamaicaJordanKazakhstanKenyaKorea, Dem. People’s Rep.Korea, Rep.KosovoKyrgyz RepublicLao PDRLatin America & Caribbean Latin America & Caribbean (excluding high income)Latin America & the Caribbean (IDA & IBRD countries)LatviaLeast developed countries: UN classificationLebanonLesothoLiberiaLibyaLithuaniaLow & middle incomeLow incomeLower middle incomeMacedonia, FYRMadagascarMalawiMalaysiaMaldivesMaliMauritaniaMauritiusMexicoMicronesia, Fed. Sts.Middle East & North AfricaMiddle East & North Africa (excluding high income)Middle East & North Africa (IDA & IBRD countries)Middle incomeMoldovaMongoliaMontenegroMoroccoMozambiqueMyanmarNamibiaNepalNicaraguaNigerNigeriaOECD membersOther small statesPacific island small statesPakistanPanamaPapua New GuineaParaguayPeruPhilippinesPolandRomaniaRussian FederationRwandaSamoaSao Tome and PrincipeSenegalSerbiaSeychellesSierra LeoneSlovak RepublicSloveniaSmall statesSolomon IslandsSomaliaSouth AfricaSouth AsiaSouth Asia (IDA & IBRD)South SudanSri LankaSt. LuciaSub-Saharan Africa Sub-Saharan Africa (excluding high income)Sub-Saharan Africa (IDA & IBRD countries)SudanSurinameSwazilandSyrian Arab RepublicTajikistanTanzaniaThailandTimor-LesteTogoTrinidad and TobagoTunisiaTurkeyTurkmenistanUgandaUkraineUpper middle incomeUruguayUzbekistanVanuatuVenezuela, RBVietnamWest Bank and GazaWorldYemen, Rep.ZambiaZimbabwe

Linea del tempo:

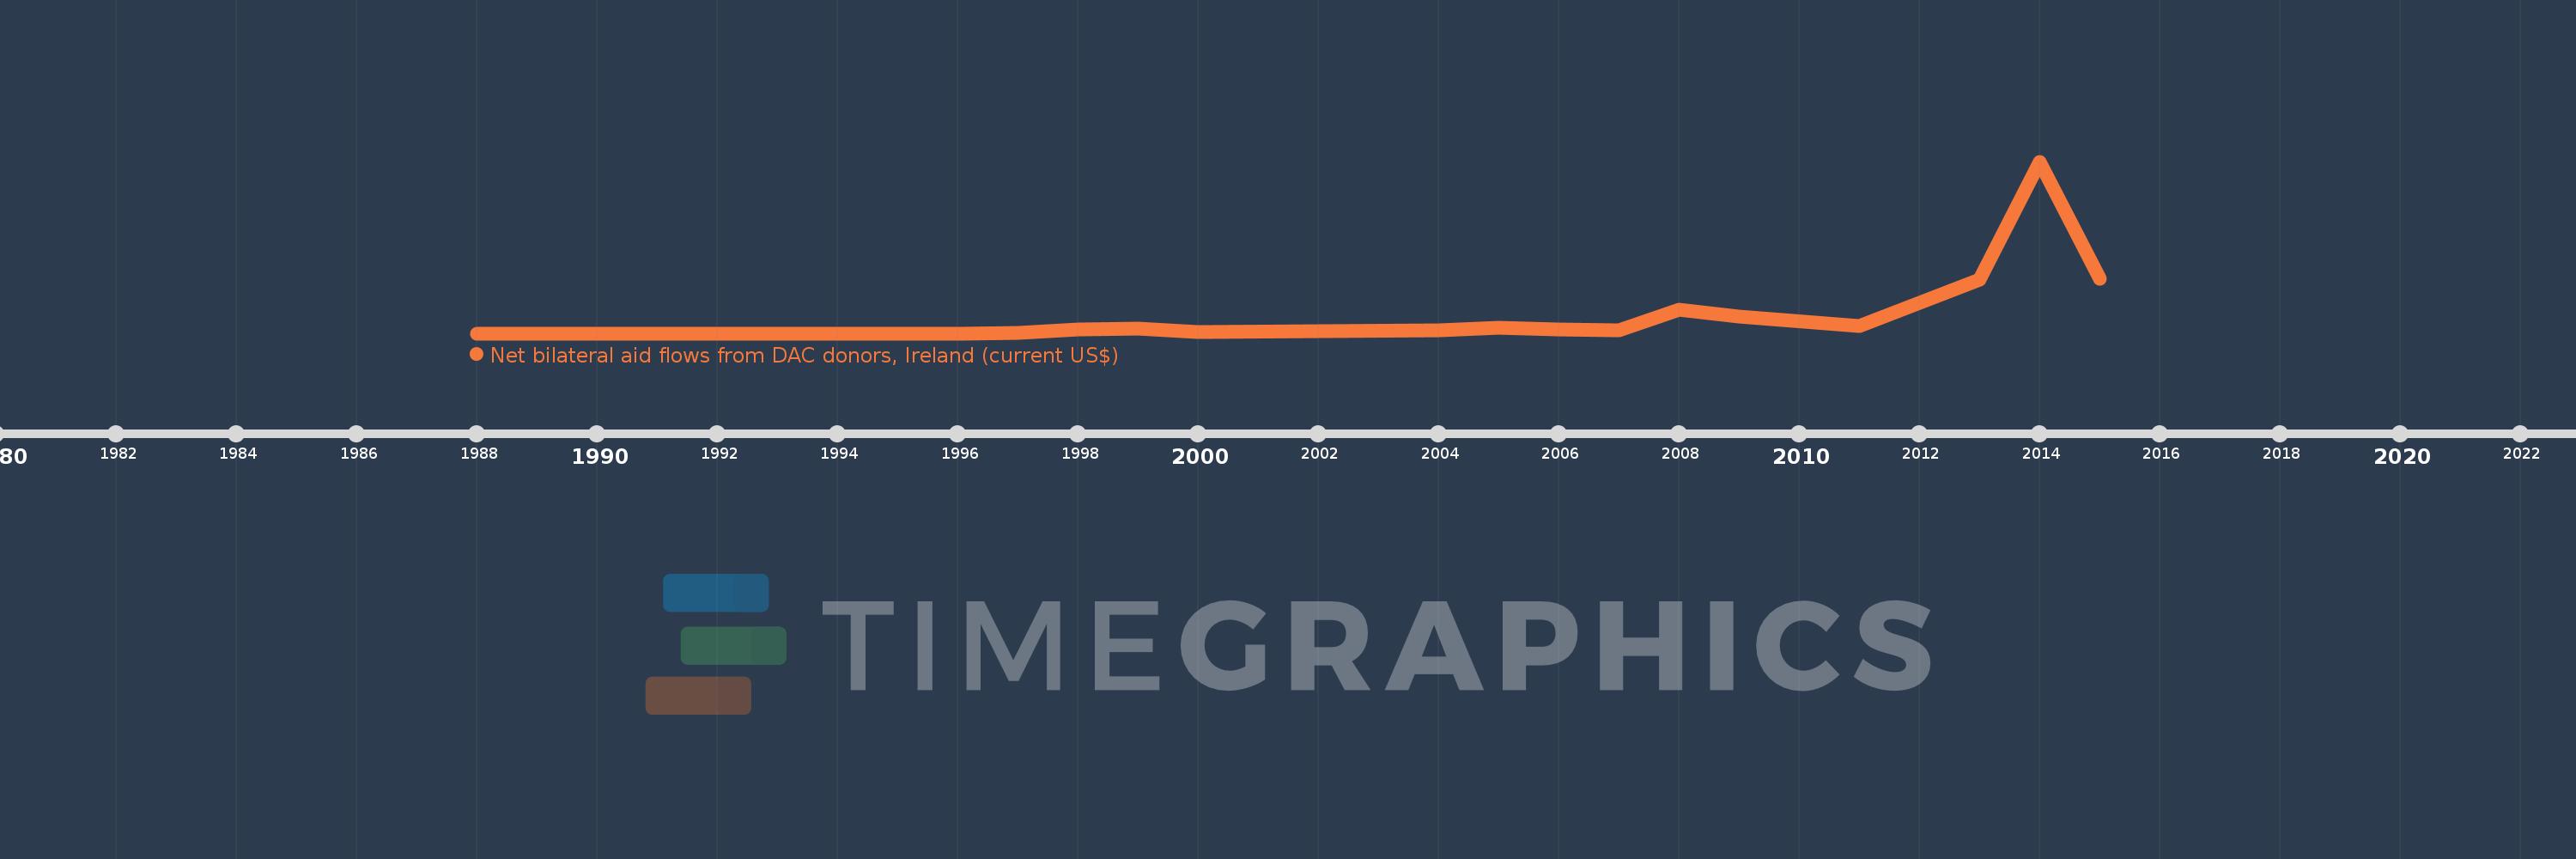
Questa scala temporale mostra un grafico dal 1988 anno al 2015 anno. Mali. I dati fino ad 1987 anno non disponibili. Il numero di osservazioni attuali secondo i date: 17.

La fonte (nome):

Indicatori dello sviluppo mondiale

La fonte (organizzazione):

Development Assistance Committee of the Organisation for Economic Co-operation and Development, Geographical Distribution of Financial Flows to Developing Countries, Development Co-operation Report, and International Development Statistics database. Data are available online at: www.oecd.org/dac/stats/idsonline.

Categorie:

Aid Effectiveness

sono stati aggiornati

23 apr 2017 anni

Indicatori delle variazioni dei valori per anni

In media:
558.235 Mille.
Minima:
10.0 Mille.
1 gen 1988 anni
Massimo:
4.53 Mln
1 gen 2014 anni
Alla data di osservazione
Valore
Variazione assoluta
La variazione rispetto al valore precedente
1 gen 1988 anni
10.0 Mille.
+10.0 Mille.
0.0%
1 gen 1989 anni
10.0 Mille.
0.0
0.0%
1 gen 1996 anni
10.0 Mille.
0.0
0.0%
1 gen 1997 anni
30.0 Mille.
+20.0 Mille.
200.0%
1 gen 1998 anni
110.0 Mille.
+80.0 Mille.
266.67%
1 gen 1999 anni
130.0 Mille.
+20.0 Mille.
18.18%
1 gen 2000 anni
50.0 Mille.
-80.0 Mille.
-61.54%
1 gen 2004 anni
80.0 Mille.
+30.0 Mille.
60.0%
1 gen 2005 anni
150.0 Mille.
+70.0 Mille.
87.5%
1 gen 2006 anni
120.0 Mille.
-30.0 Mille.
-20.0%
1 gen 2007 anni
90.0 Mille.
-30.0 Mille.
-25.0%
1 gen 2008 anni
640.0 Mille.
+550.0 Mille.
611.11%
1 gen 2009 anni
450.0 Mille.
-190.0 Mille.
-29.69%
1 gen 2011 anni
200.0 Mille.
-250.0 Mille.
-55.56%
1 gen 2013 anni
1.43 Mln
+1.23 Mln
615.0%
1 gen 2014 anni
4.53 Mln
+3.1 Mln
216.78%
1 gen 2015 anni
1.45 Mln
-3.08 Mln
-67.99%

Classificazione dei paesi secondo i statistiche attuali per anni