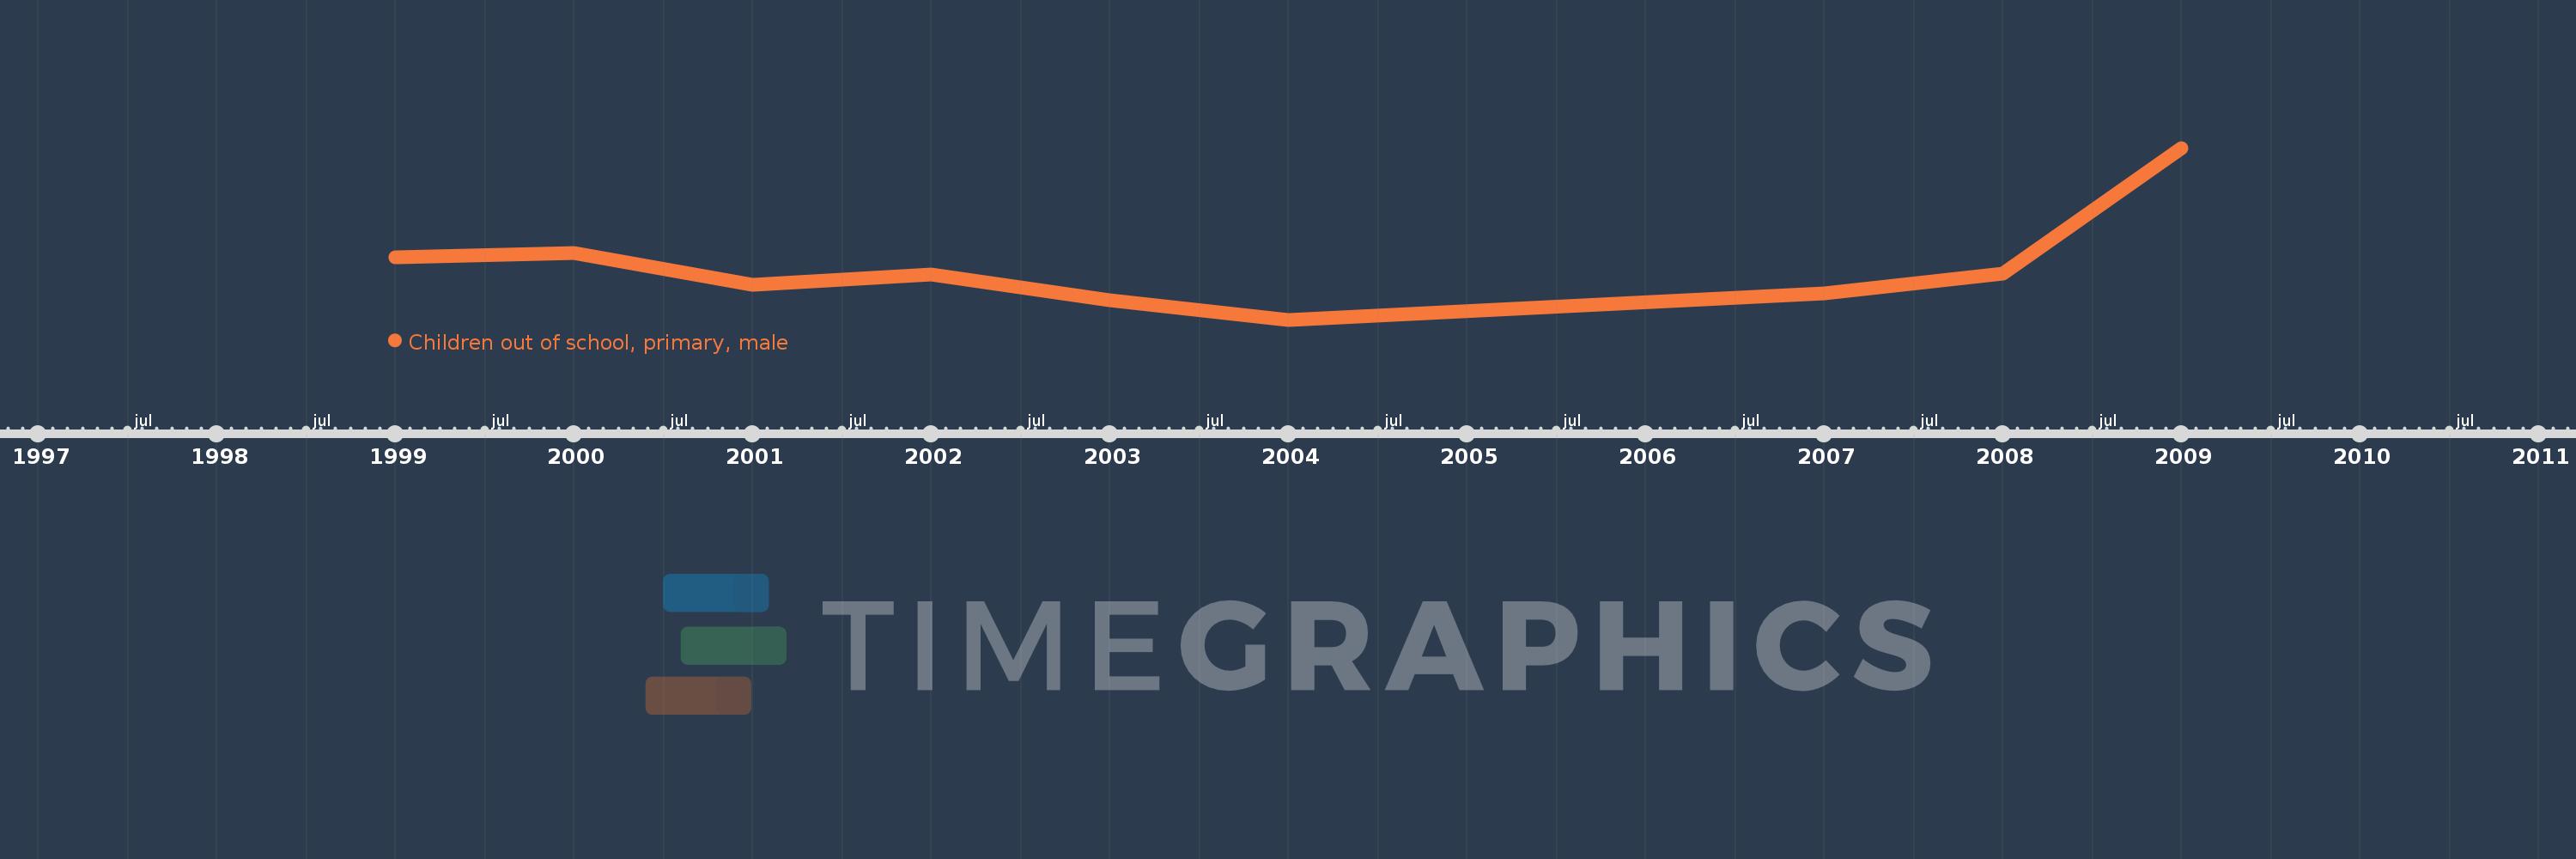
Questa scala temporale mostra un grafico dal 1999 anno al 2009 anno. Bolivia. I dati fino ad 1998 anno non disponibili. Il numero di osservazioni attuali secondo i date: 9.
La fonte (nome):
Indicatori dello sviluppo mondiale
La fonte (organizzazione):
United Nations Educational, Scientific, and Cultural Organization (UNESCO) Institute for Statistics.
Categorie:
Education, Gender
sono stati aggiornati
23 apr 2017 anni
Indicatori delle variazioni dei valori per anni
In media:
23.362 Mille.
Minima:
18.723 Mille.
1 gen 2004 anni
Massimo:
33.835 Mille.
1 gen 2009 anni
Alla data di osservazione
Valore
Variazione assoluta
La variazione rispetto al valore precedente
1 gen 1999 anni
24.219 Mille.
+24.219 Mille.
0.0%
1 gen 2000 anni
24.62 Mille.
+401.0
1.66%
1 gen 2001 anni
21.824 Mille.
-2.796 Mille.
-11.36%
1 gen 2002 anni
22.734 Mille.
+910.0
4.17%
1 gen 2003 anni
20.44 Mille.
-2.294 Mille.
-10.09%
1 gen 2004 anni
18.723 Mille.
-1.717 Mille.
-8.4%
1 gen 2007 anni
21.074 Mille.
+2.351 Mille.
12.56%
1 gen 2008 anni
22.791 Mille.
+1.717 Mille.
8.15%
1 gen 2009 anni
33.835 Mille.
+11.044 Mille.
48.46%
Classificazione dei paesi secondo i statistiche attuali per anni