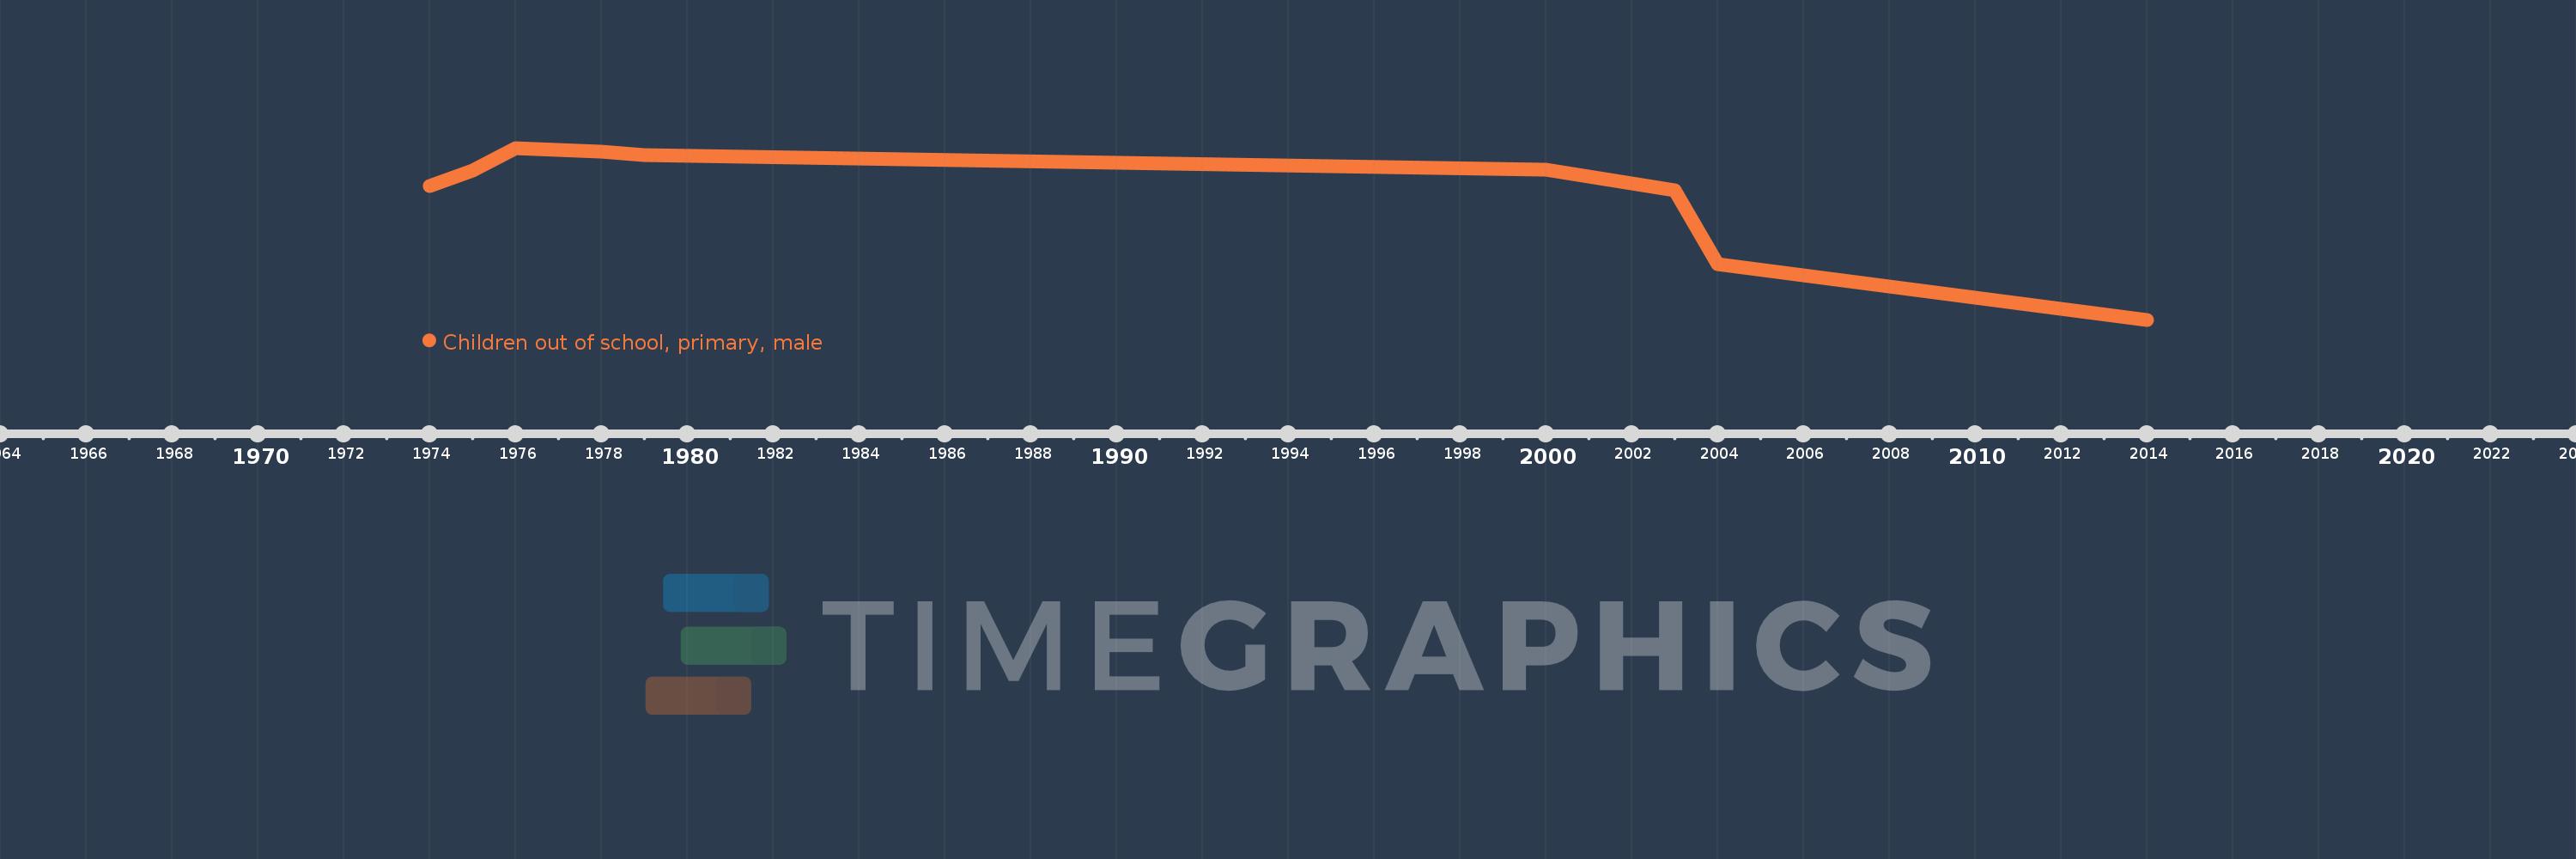
Questa scala temporale mostra un grafico dal 1974 anno al 2014 anno. Rwanda. I dati fino ad 1973 anno non disponibili. Il numero di osservazioni attuali secondo i date: 9.
La fonte (nome):
Indicatori dello sviluppo mondiale
La fonte (organizzazione):
United Nations Educational, Scientific, and Cultural Organization (UNESCO) Institute for Statistics.
Categorie:
Education, Gender
sono stati aggiornati
23 apr 2017 anni
Indicatori delle variazioni dei valori per anni
In media:
123.875 Mille.
Minima:
44.784 Mille.
1 gen 2014 anni
Massimo:
153.567 Mille.
1 gen 1976 anni
Alla data di osservazione
Valore
Variazione assoluta
La variazione rispetto al valore precedente
1 gen 1974 anni
129.681 Mille.
+129.681 Mille.
0.0%
1 gen 1975 anni
139.466 Mille.
+9.785 Mille.
7.55%
1 gen 1976 anni
153.567 Mille.
+14.101 Mille.
10.11%
1 gen 1978 anni
151.393 Mille.
-2.174 Mille.
-1.42%
1 gen 1979 anni
149.318 Mille.
-2.075 Mille.
-1.37%
1 gen 2000 anni
139.945 Mille.
-9.373 Mille.
-6.28%
1 gen 2003 anni
126.938 Mille.
-13.007 Mille.
-9.29%
1 gen 2004 anni
79.78 Mille.
-47.158 Mille.
-37.15%
1 gen 2014 anni
44.784 Mille.
-34.996 Mille.
-43.87%
Classificazione dei paesi secondo i statistiche attuali per anni