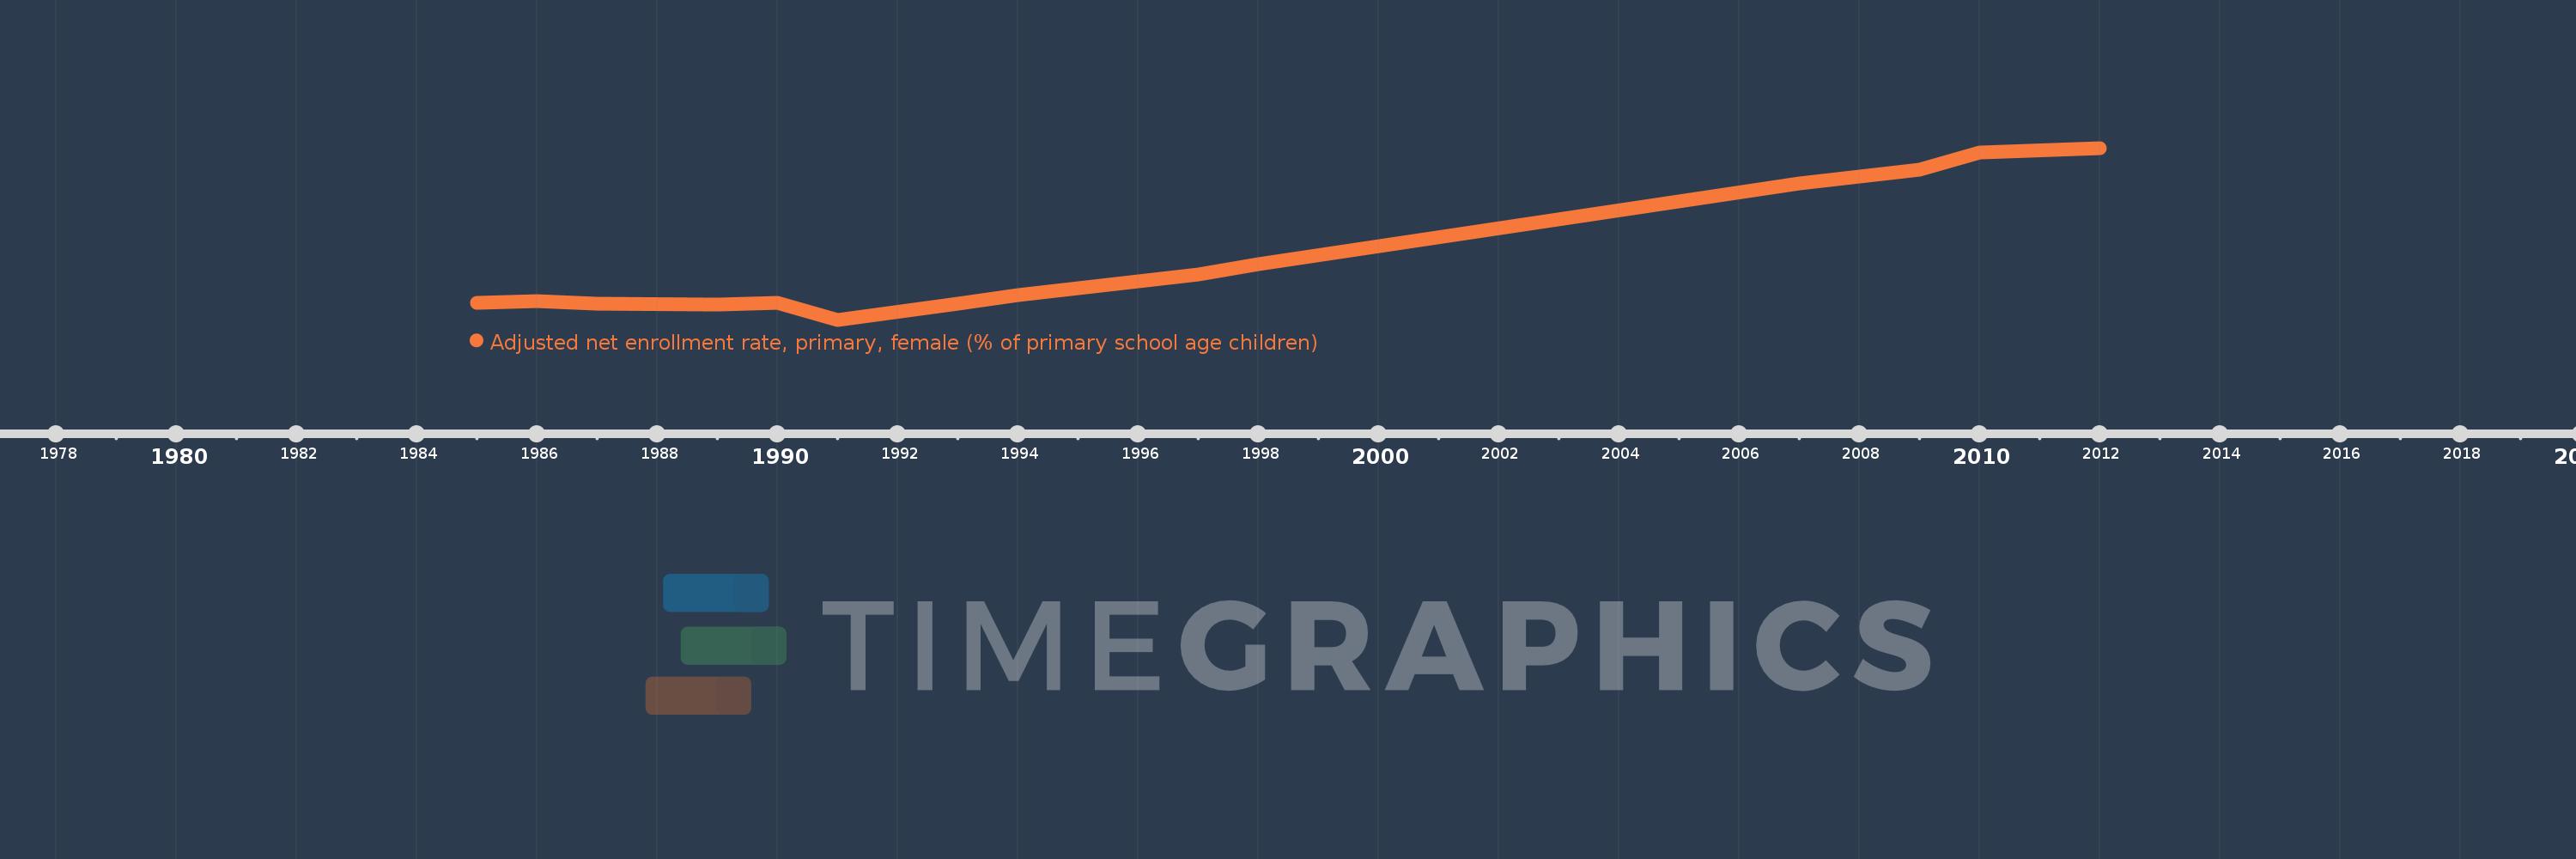
Questa scala temporale mostra un grafico dal 1985 anno al 2012 anno. Benin. I dati fino ad 1984 anno non disponibili. Il numero di osservazioni attuali secondo i date: 16.
La fonte (nome):
Indicatori dello sviluppo mondiale
La fonte (organizzazione):
United Nations Educational, Scientific, and Cultural Organization (UNESCO) Institute for Statistics.
Categorie:
Education, Gender
sono stati aggiornati
23 apr 2017 anni
Indicatori delle variazioni dei valori per anni
In media:
47.131
Minima:
26.48
1 gen 1991 anni
Massimo:
88.195
1 gen 2012 anni
Alla data di osservazione
Valore
Variazione assoluta
La variazione rispetto al valore precedente
1 gen 1985 anni
32.414
+32.414
0.0%
1 gen 1986 anni
33.06
+0.646
1.99%
1 gen 1987 anni
32.115
-0.945
-2.86%
1 gen 1989 anni
32.043
-0.071
-0.22%
1 gen 1990 anni
32.505
+0.461
1.44%
1 gen 1991 anni
26.48
-6.024
-18.53%
1 gen 1993 anni
32.234
+5.753
21.73%
1 gen 1994 anni
35.44
+3.206
9.95%
1 gen 1995 anni
37.731
+2.292
6.47%
1 gen 1996 anni
40.22
+2.488
6.59%
1 gen 1997 anni
42.772
+2.552
6.35%
1 gen 1998 anni
46.322
+3.55
8.3%
1 gen 2007 anni
75.539
+29.217
63.07%
1 gen 2009 anni
80.401
+4.862
6.44%
1 gen 2010 anni
86.619
+6.218
7.73%
1 gen 2012 anni
88.195
+1.576
1.82%
Classificazione dei paesi secondo i statistiche attuali per anni