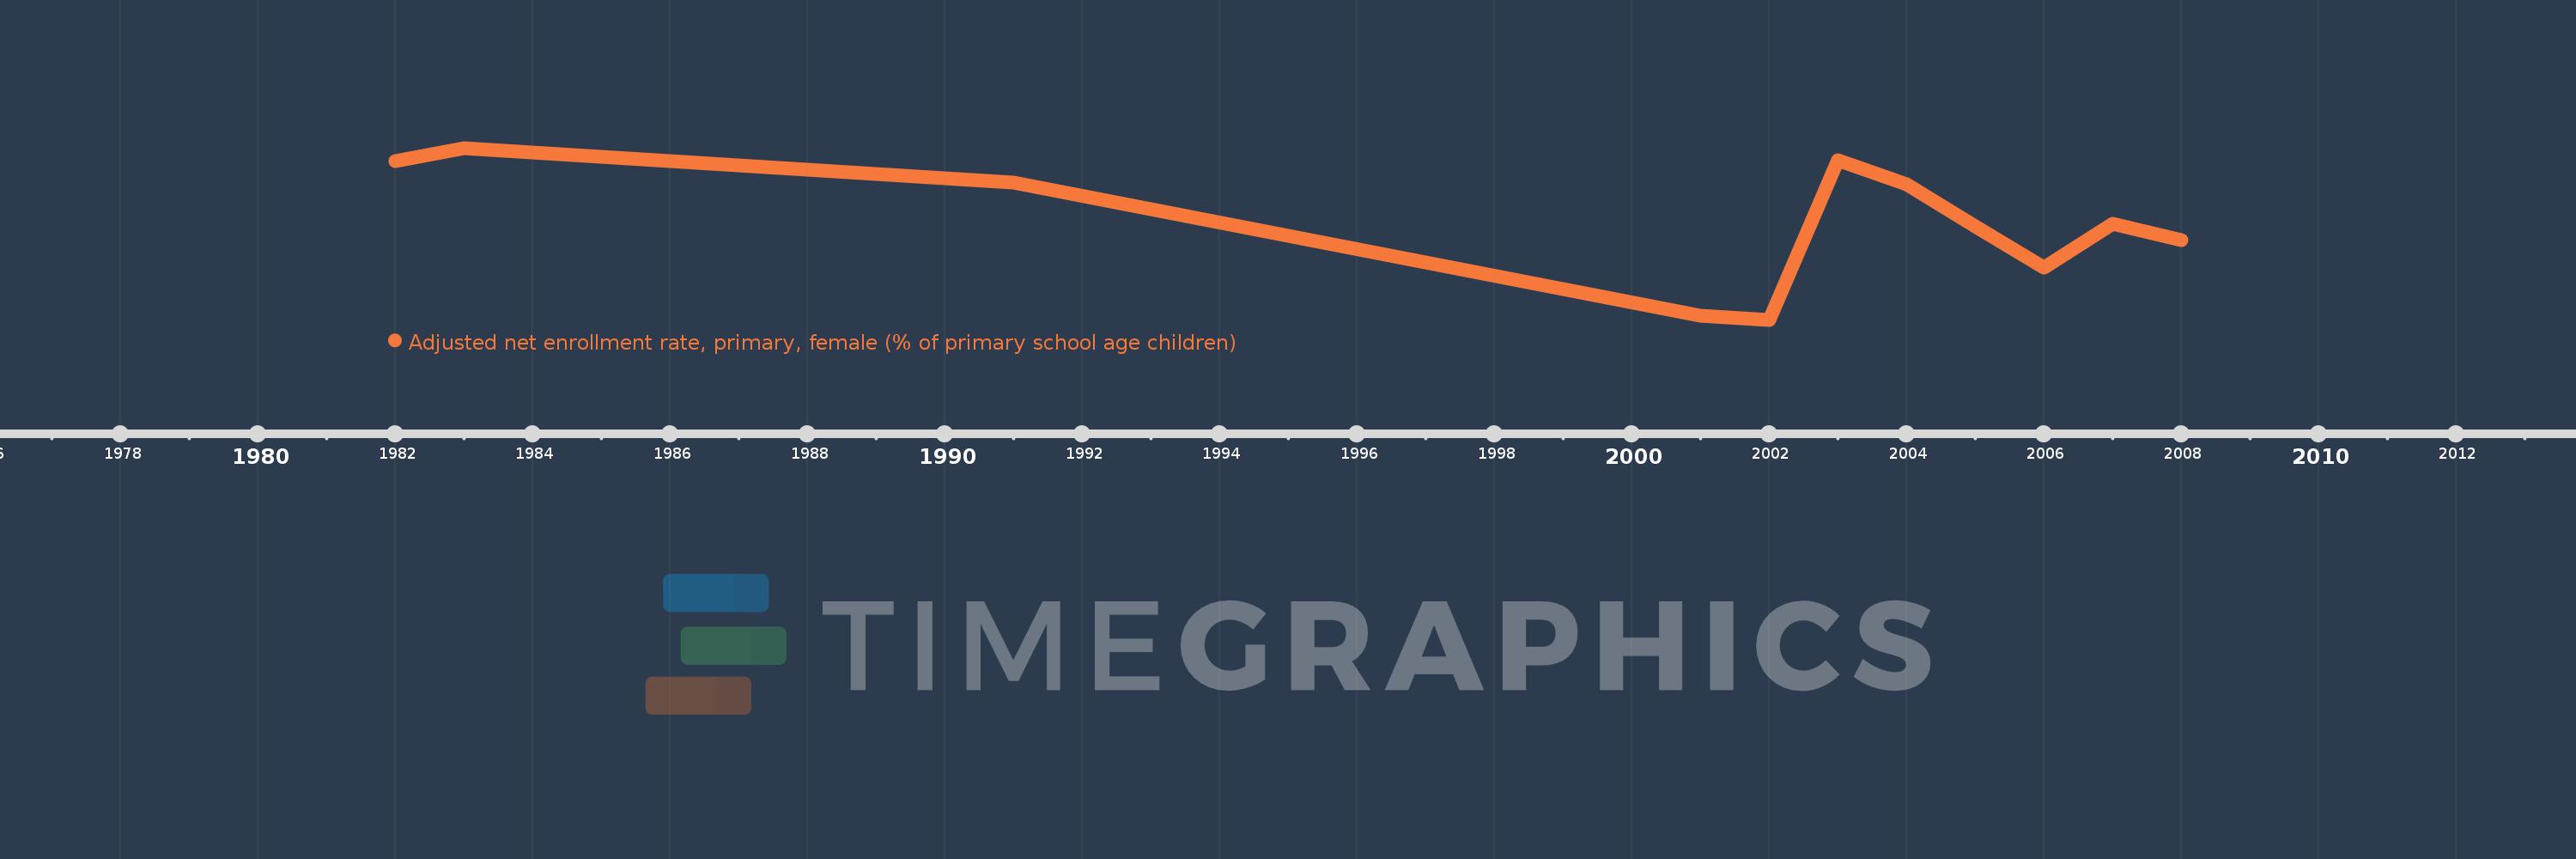
Questa scala temporale mostra un grafico dal 1982 anno al 2008 anno. St. Lucia. I dati fino ad 1981 anno non disponibili. Il numero di osservazioni attuali secondo i date: 11.
La fonte (nome):
Indicatori dello sviluppo mondiale
La fonte (organizzazione):
United Nations Educational, Scientific, and Cultural Organization (UNESCO) Institute for Statistics.
Categorie:
Education, Gender
sono stati aggiornati
23 apr 2017 anni
Indicatori delle variazioni dei valori per anni
In media:
93.854
Minima:
88.487
1 gen 2002 anni
Massimo:
97.814
1 gen 1983 anni
Alla data di osservazione
Valore
Variazione assoluta
La variazione rispetto al valore precedente
1 gen 1982 anni
97.097
+97.097
0.0%
1 gen 1983 anni
97.814
+0.717
0.74%
1 gen 1991 anni
95.925
-1.889
-1.93%
1 gen 2001 anni
88.685
-7.24
-7.55%
1 gen 2002 anni
88.487
-0.199
-0.22%
1 gen 2003 anni
97.151
+8.664
9.79%
1 gen 2004 anni
95.849
-1.302
-1.34%
1 gen 2005 anni
93.571
-2.278
-2.38%
1 gen 2006 anni
91.331
-2.24
-2.39%
1 gen 2007 anni
93.683
+2.352
2.58%
1 gen 2008 anni
92.806
-0.877
-0.94%
Classificazione dei paesi secondo i statistiche attuali per anni