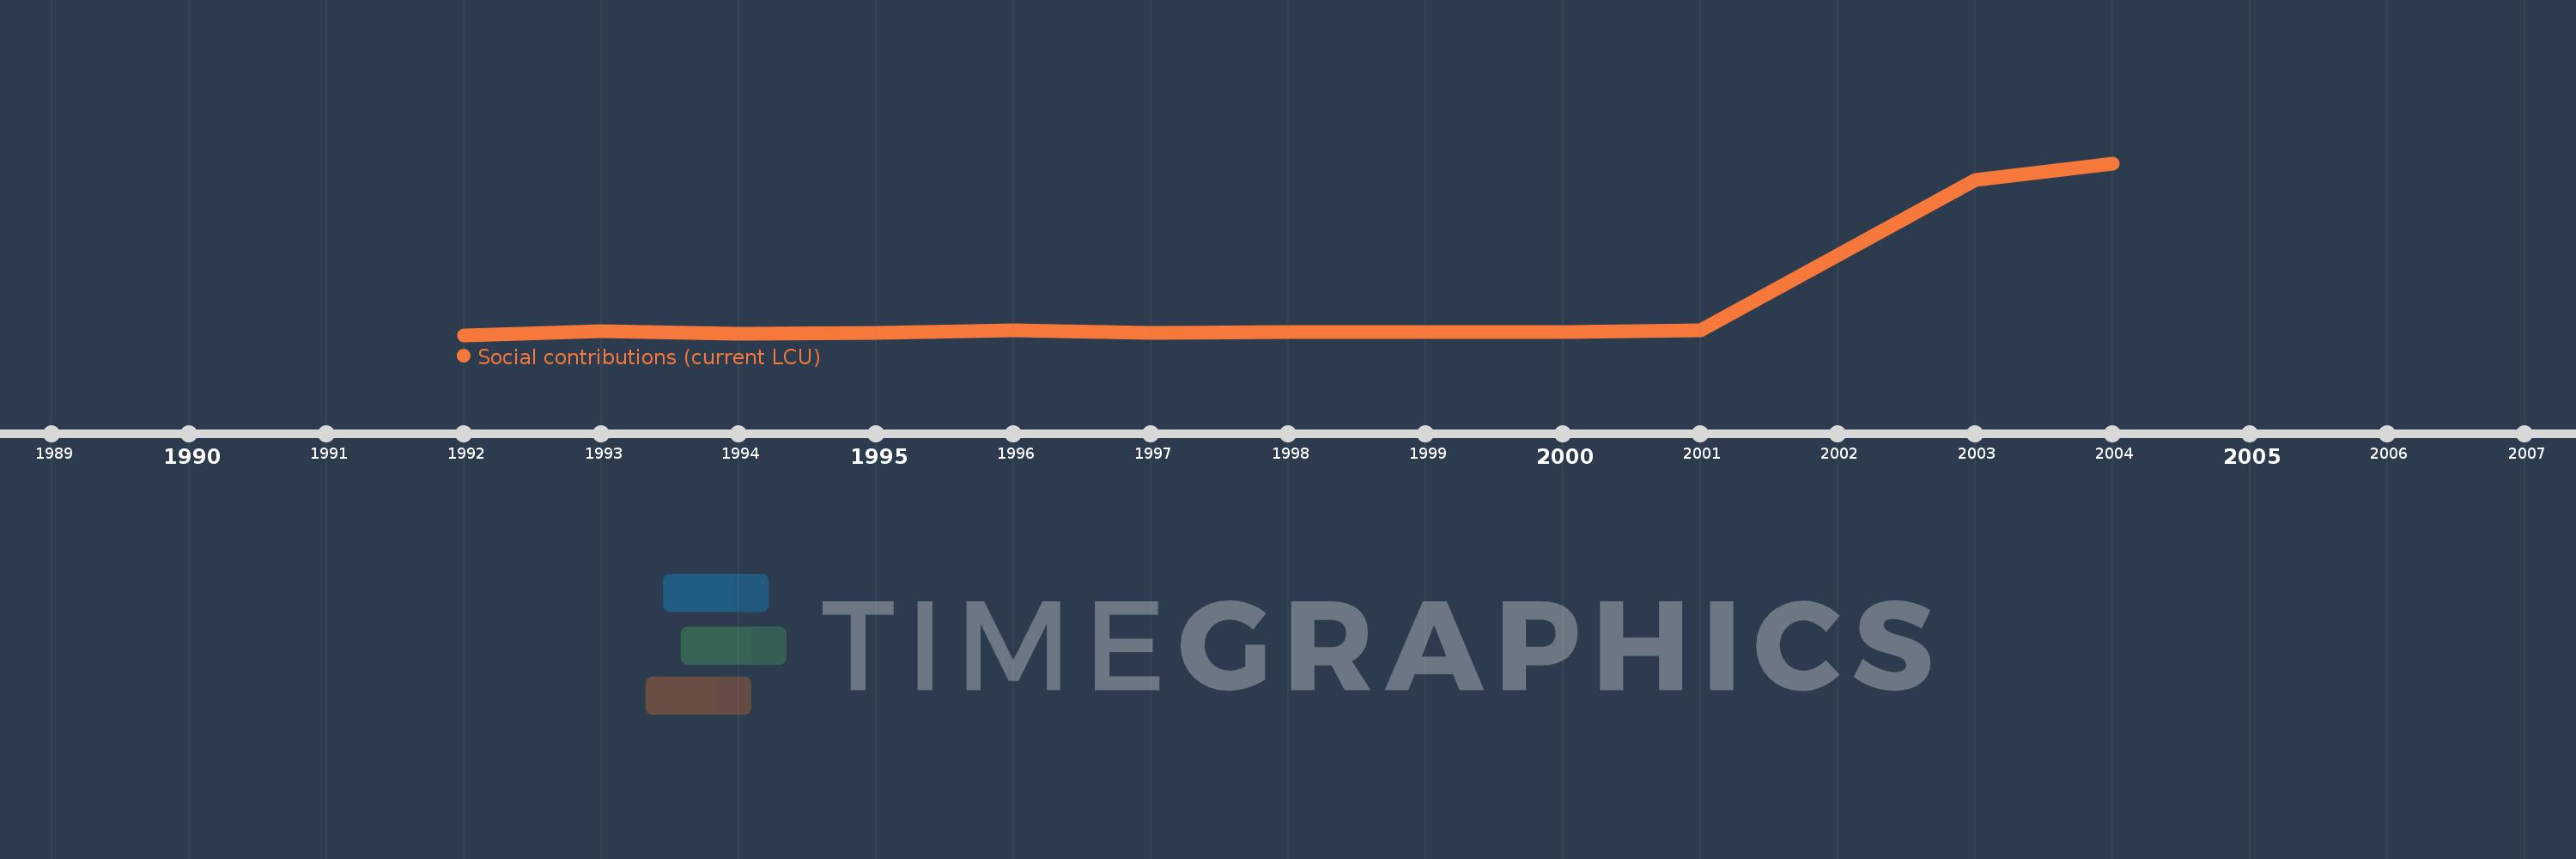
Questa scala temporale mostra un grafico dal 1992 anno al 2004 anno. Belize. I dati fino ad 1991 anno non disponibili. Il numero di osservazioni attuali secondo i date: 12.
La fonte (nome):
Indicatori dello sviluppo mondiale
La fonte (organizzazione):
International Monetary Fund, Government Finance Statistics Yearbook and data files.
Categorie:
Public Sector
sono stati aggiornati
23 apr 2017 anni
Indicatori delle variazioni dei valori per anni
In media:
1.877 Mln
Minima:
184.0 Mille.
1 gen 1992 anni
Massimo:
9.984 Mln
1 gen 2004 anni
Alla data di osservazione
Valore
Variazione assoluta
La variazione rispetto al valore precedente
1 gen 1992 anni
184.0 Mille.
+184.0 Mille.
0.0%
1 gen 1993 anni
391.0 Mille.
+207.0 Mille.
112.5%
1 gen 1994 anni
281.0 Mille.
-110.0 Mille.
-28.13%
1 gen 1995 anni
318.0 Mille.
+37.0 Mille.
13.17%
1 gen 1996 anni
462.0 Mille.
+144.0 Mille.
45.28%
1 gen 1997 anni
306.0 Mille.
-156.0 Mille.
-33.77%
1 gen 1998 anni
363.0 Mille.
+57.0 Mille.
18.63%
1 gen 1999 anni
380.0 Mille.
+17.0 Mille.
4.68%
1 gen 2000 anni
366.0 Mille.
-14.0 Mille.
-3.68%
1 gen 2001 anni
445.0 Mille.
+79.0 Mille.
21.58%
1 gen 2003 anni
9.043 Mln
+8.598 Mln
1.93 Mille.%
1 gen 2004 anni
9.984 Mln
+941.0 Mille.
10.41%
Classificazione dei paesi secondo i statistiche attuali per anni