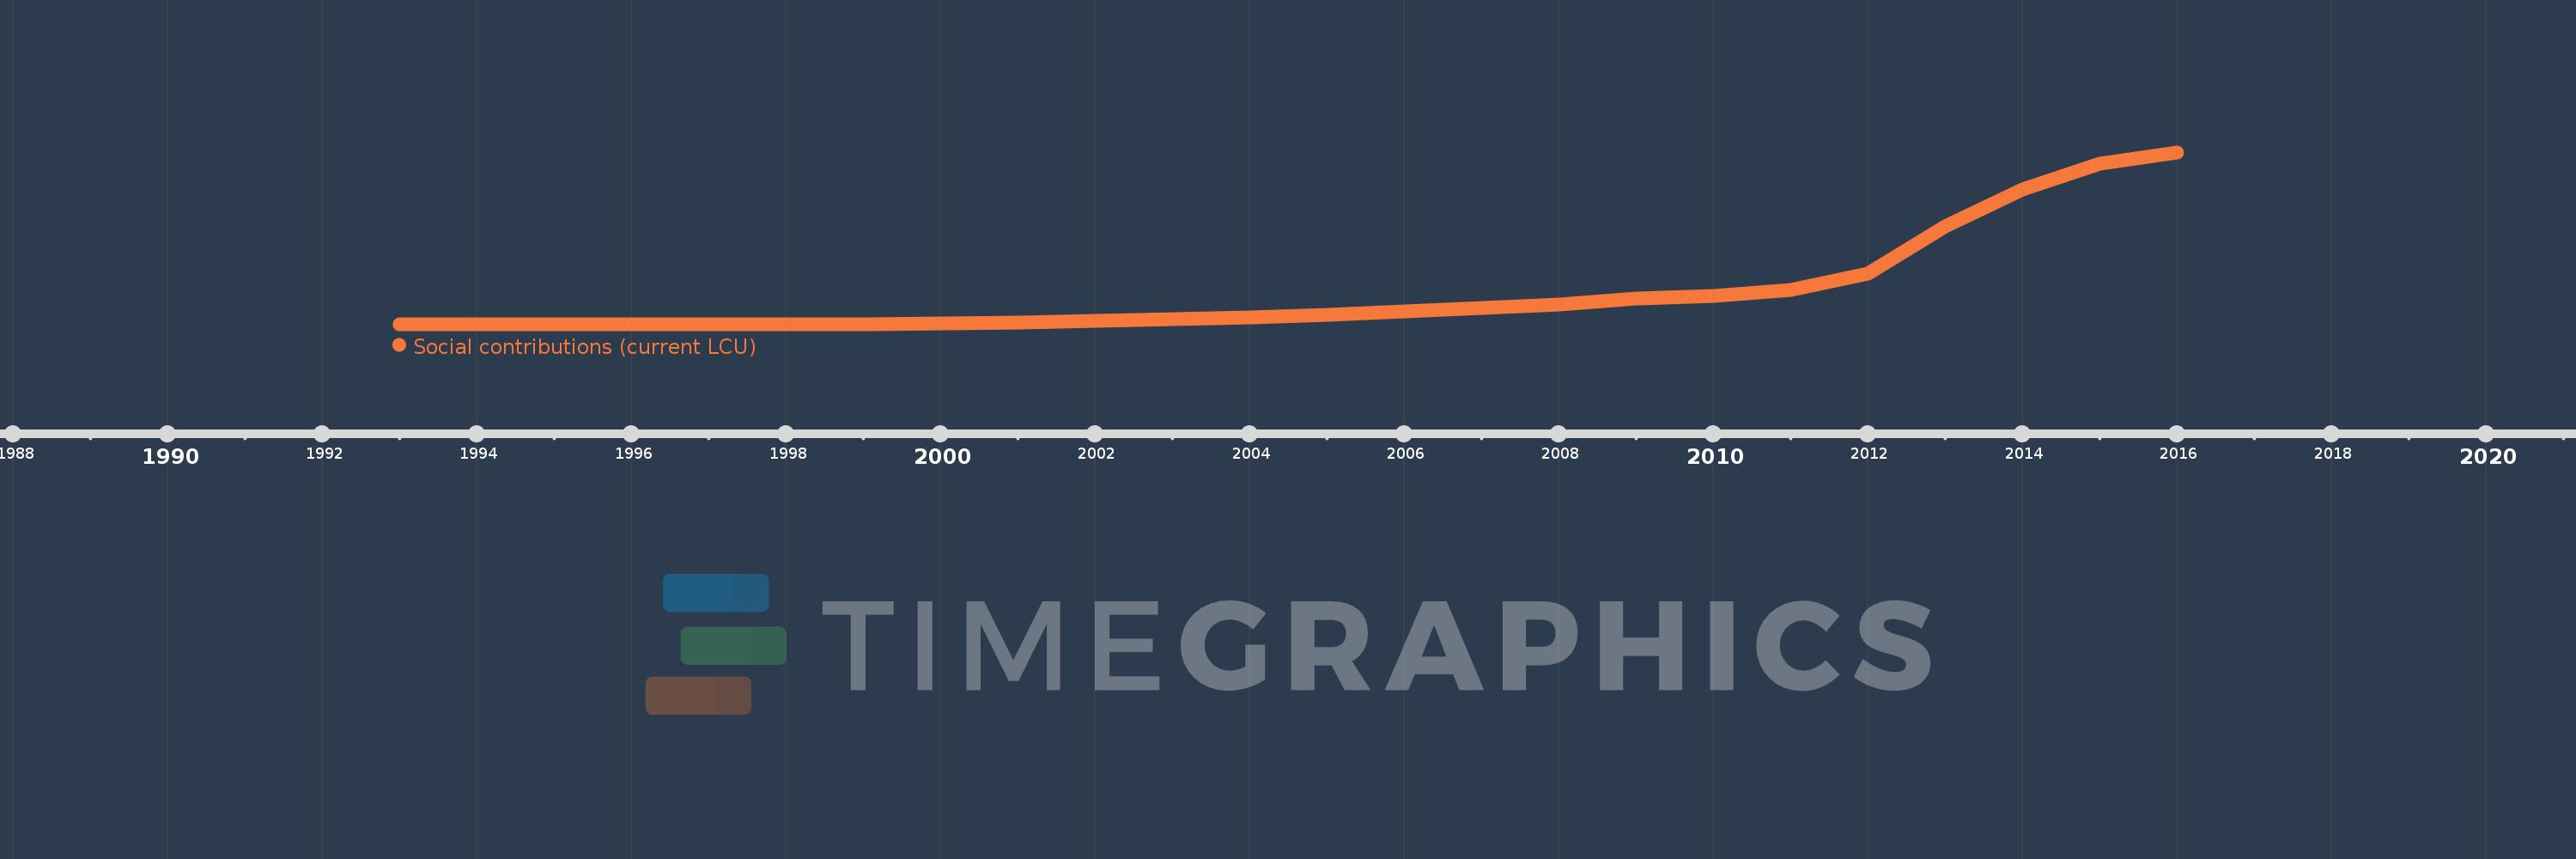
Questa scala temporale mostra un grafico dal 1993 anno al 2016 anno. Belarus. I dati fino ad 1992 anno non disponibili. Il numero di osservazioni attuali secondo i date: 24.
La fonte (nome):
Indicatori dello sviluppo mondiale
La fonte (organizzazione):
International Monetary Fund, Government Finance Statistics Yearbook and data files.
Categorie:
Public Sector
sono stati aggiornati
23 apr 2017 anni
Indicatori delle variazioni dei valori per anni
In media:
18.39 Trln
Minima:
9.2 Mln
1 gen 1993 anni
Massimo:
97.152 Trln
1 gen 2016 anni
Alla data di osservazione
Valore
Variazione assoluta
La variazione rispetto al valore precedente
1 gen 1993 anni
9.2 Mln
+9.2 Mln
0.0%
1 gen 1994 anni
100.1 Mln
+90.9 Mln
988.04%
1 gen 1995 anni
1.441 Mlrd
+1.341 Mlrd
1.34 Mille.%
1 gen 1996 anni
11.365 Mlrd
+9.925 Mlrd
688.82%
1 gen 1997 anni
18.173 Mlrd
+6.808 Mlrd
59.9%
1 gen 1998 anni
35.536 Mlrd
+17.363 Mlrd
95.54%
1 gen 1999 anni
70.013 Mlrd
+34.477 Mlrd
97.02%
1 gen 2000 anni
297.858 Mlrd
+227.846 Mlrd
325.44%
1 gen 2001 anni
928.75 Mlrd
+630.891 Mlrd
211.81%
1 gen 2002 anni
1.863 Trln
+934.64 Mlrd
100.63%
1 gen 2003 anni
2.846 Trln
+982.23 Mlrd
52.71%
1 gen 2004 anni
3.883 Trln
+1.037 Trln
36.45%
1 gen 2005 anni
5.374 Trln
+1.491 Trln
38.41%
1 gen 2006 anni
7.345 Trln
+1.971 Trln
36.68%
1 gen 2007 anni
9.288 Trln
+1.942 Trln
26.44%
1 gen 2008 anni
11.257 Trln
+1.969 Trln
21.2%
1 gen 2009 anni
14.497 Trln
+3.24 Trln
28.78%
1 gen 2010 anni
15.799 Trln
+1.303 Trln
8.99%
1 gen 2011 anni
19.249 Trln
+3.45 Trln
21.84%
1 gen 2012 anni
28.802 Trln
+9.552 Trln
49.62%
1 gen 2013 anni
55.436 Trln
+26.634 Trln
92.47%
1 gen 2014 anni
76.298 Trln
+20.862 Trln
37.63%
1 gen 2015 anni
90.909 Trln
+14.611 Trln
19.15%
1 gen 2016 anni
97.152 Trln
+6.243 Trln
6.87%
Classificazione dei paesi secondo i statistiche attuali per anni