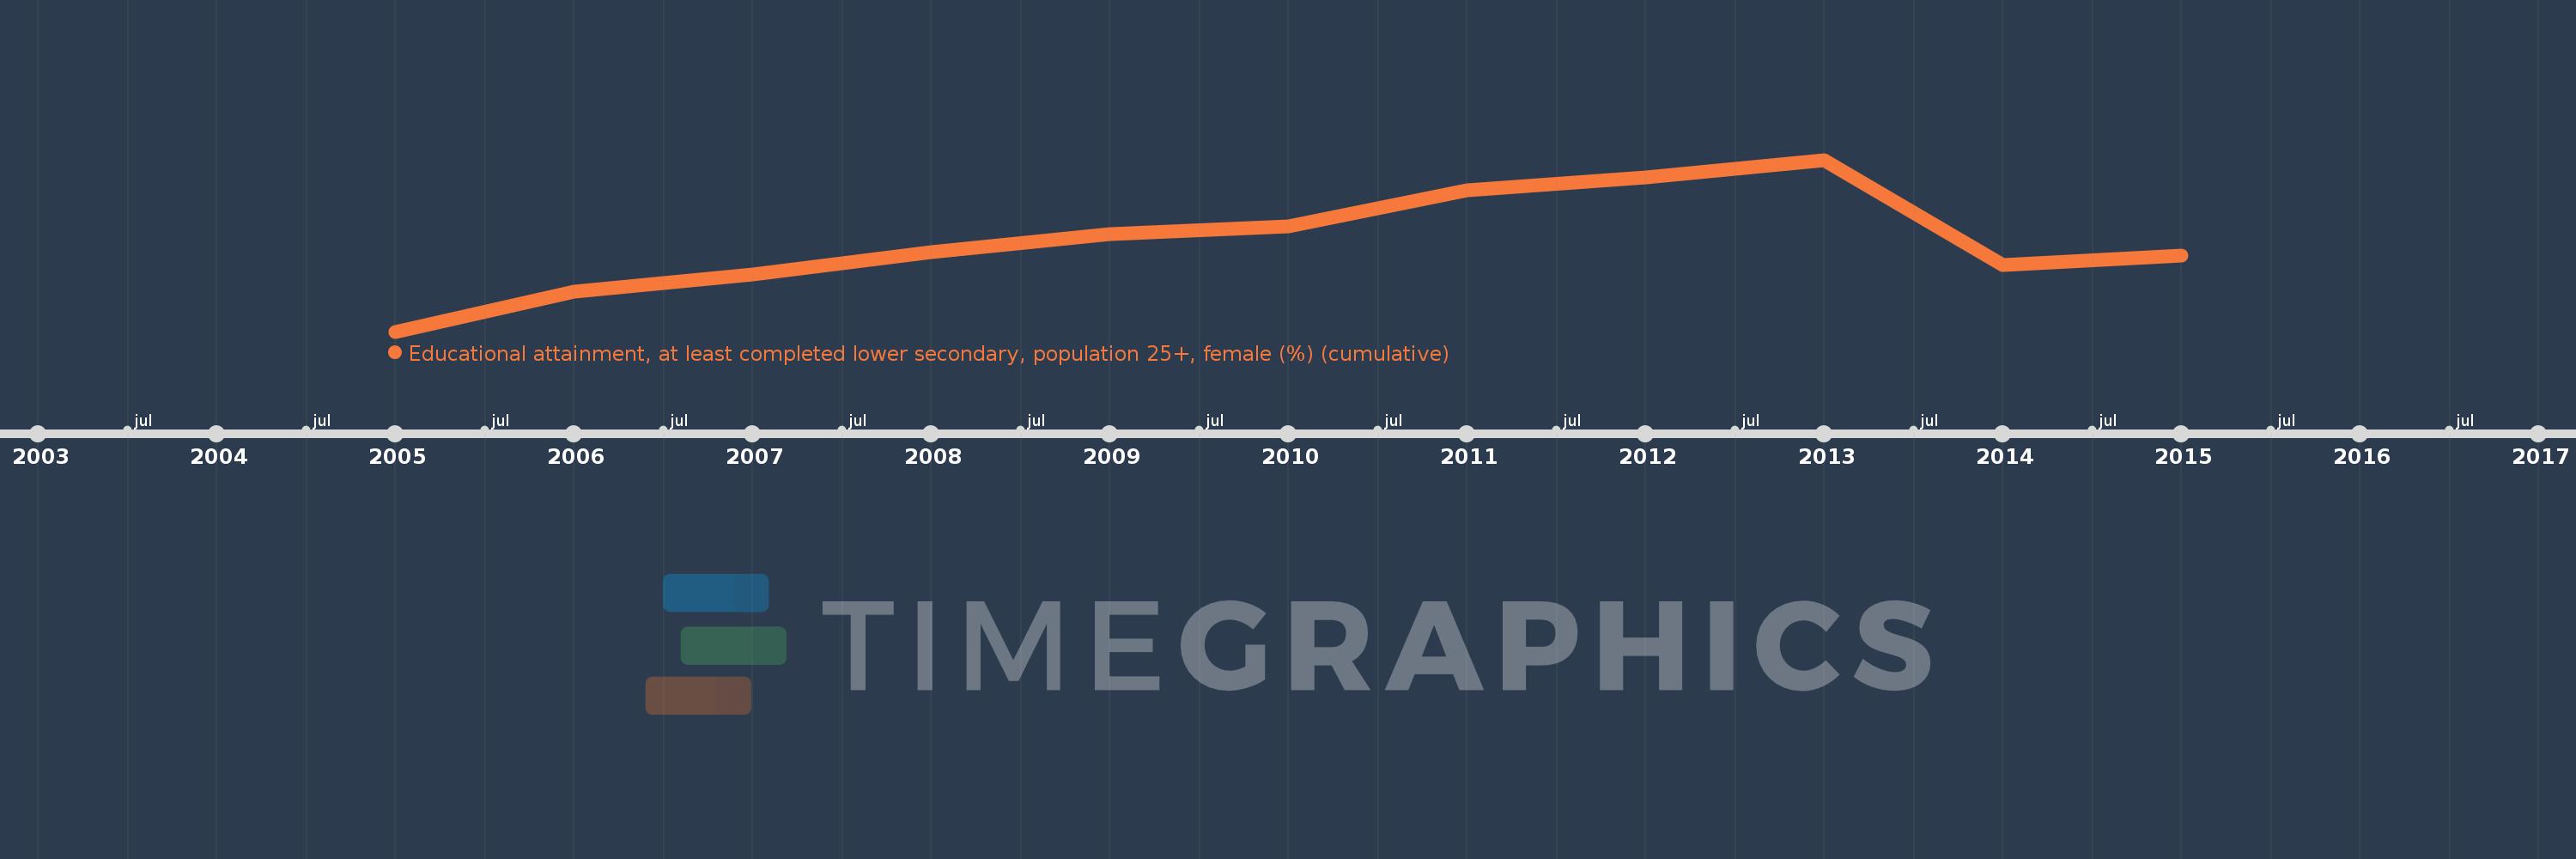
Questa scala temporale mostra un grafico dal 2005 anno al 2015 anno. Australia. I dati fino ad 2004 anno non disponibili. Il numero di osservazioni attuali secondo i date: 11.
La fonte (nome):
Indicatori dello sviluppo mondiale
La fonte (organizzazione):
United Nations Educational, Scientific, and Cultural Organization (UNESCO) Institute for Statistics.
Categorie:
Education, Gender
sono stati aggiornati
23 apr 2017 anni
Indicatori delle variazioni dei valori per anni
In media:
91.785
Minima:
89.043
1 gen 2005 anni
Massimo:
94.278
1 gen 2013 anni
Alla data di osservazione
Valore
Variazione assoluta
La variazione rispetto al valore precedente
1 gen 2005 anni
89.043
+89.043
0.0%
1 gen 2006 anni
90.262
+1.219
1.37%
1 gen 2007 anni
90.777
+0.515
0.57%
1 gen 2008 anni
91.471
+0.694
0.76%
1 gen 2009 anni
92.021
+0.55
0.6%
1 gen 2010 anni
92.242
+0.221
0.24%
1 gen 2011 anni
93.352
+1.11
1.2%
1 gen 2012 anni
93.742
+0.39
0.42%
1 gen 2013 anni
94.278
+0.536
0.57%
1 gen 2014 anni
91.078
-3.2
-3.39%
1 gen 2015 anni
91.37
+0.292
0.32%
Classificazione dei paesi secondo i statistiche attuali per anni