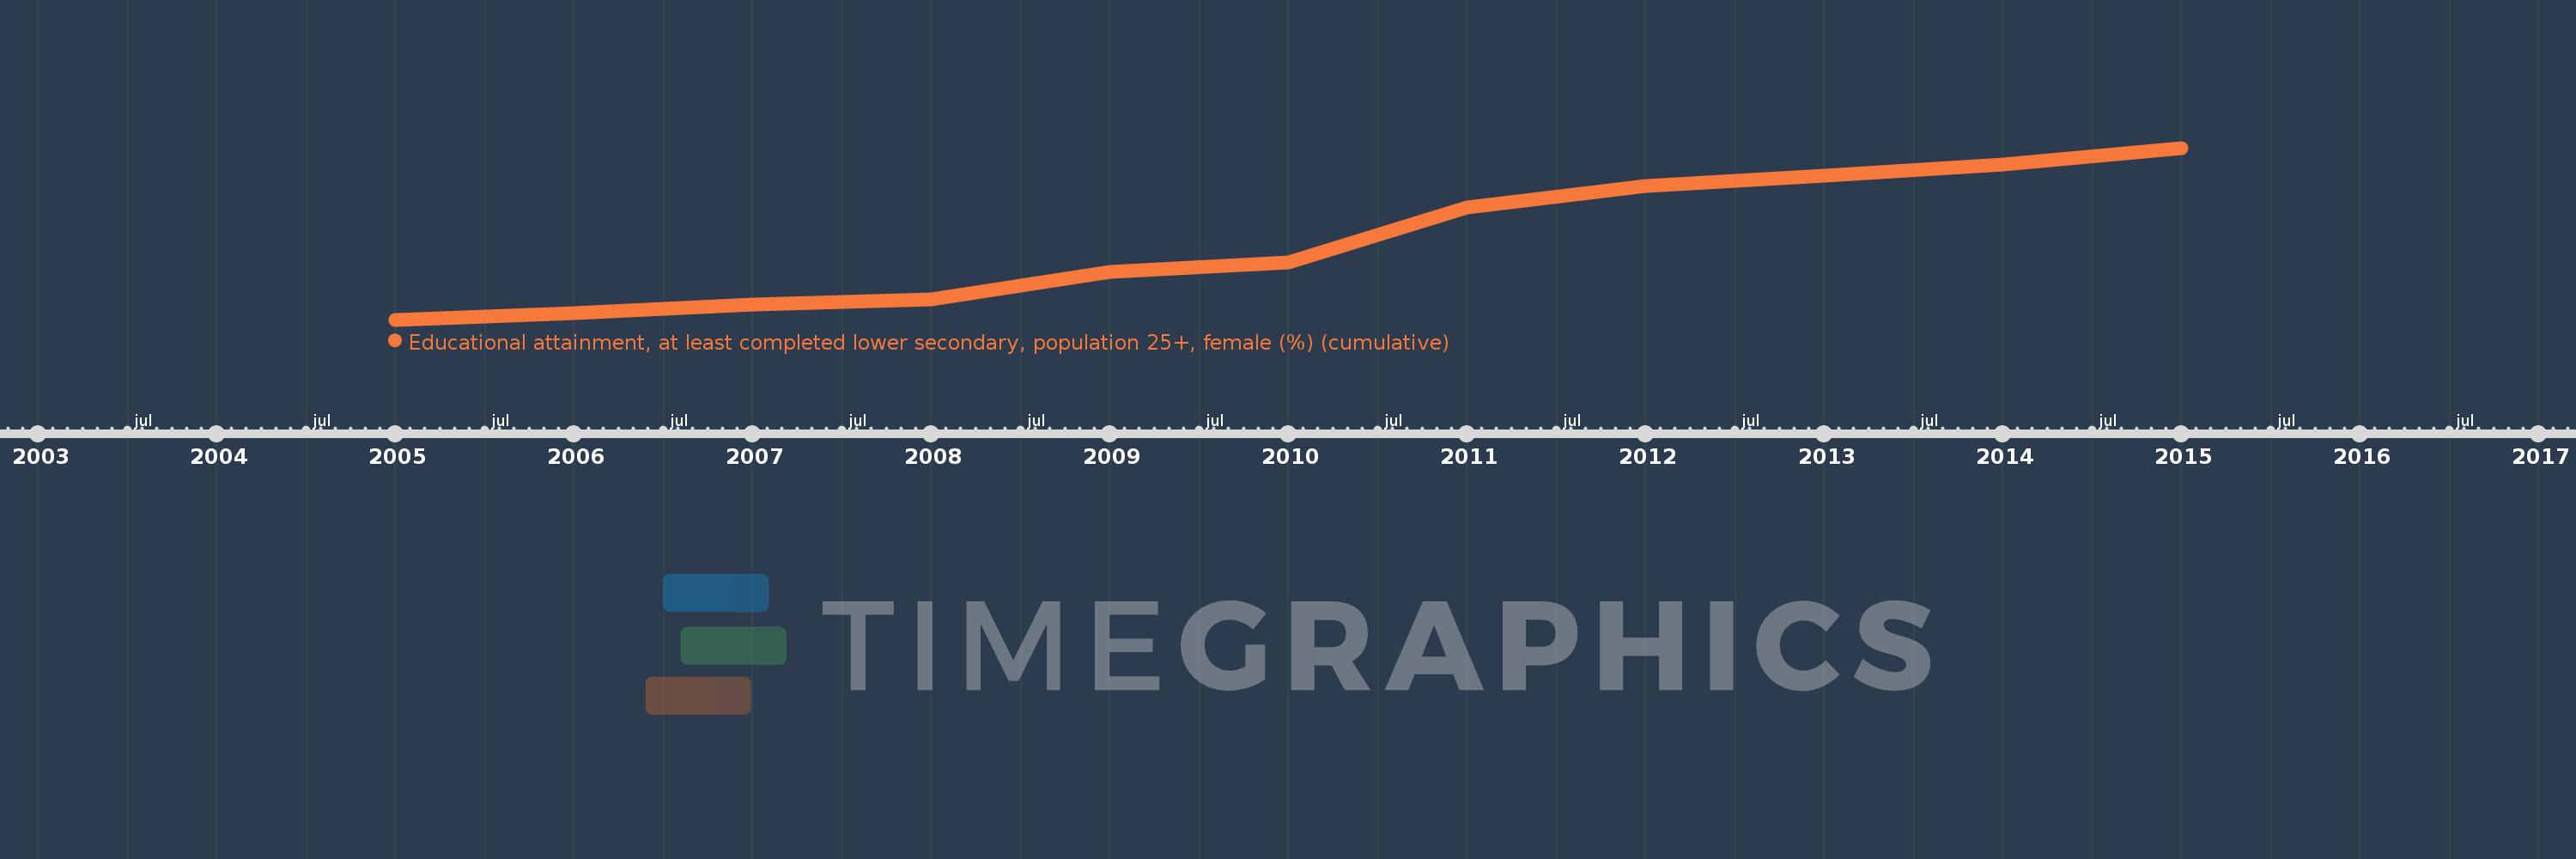
Questa scala temporale mostra un grafico dal 2005 anno al 2015 anno. Turkey. I dati fino ad 2004 anno non disponibili. Il numero di osservazioni attuali secondo i date: 11.
La fonte (nome):
Indicatori dello sviluppo mondiale
La fonte (organizzazione):
United Nations Educational, Scientific, and Cultural Organization (UNESCO) Institute for Statistics.
Categorie:
Education, Gender
sono stati aggiornati
23 apr 2017 anni
Indicatori delle variazioni dei valori per anni
In media:
31.082
Minima:
19.994
1 gen 2005 anni
Massimo:
44.244
1 gen 2015 anni
Alla data di osservazione
Valore
Variazione assoluta
La variazione rispetto al valore precedente
1 gen 2005 anni
19.994
+19.994
0.0%
1 gen 2006 anni
20.935
+0.941
4.71%
1 gen 2007 anni
22.189
+1.254
5.99%
1 gen 2008 anni
22.856
+0.667
3.01%
1 gen 2009 anni
26.753
+3.896
17.05%
1 gen 2010 anni
28.09
+1.337
5.0%
1 gen 2011 anni
35.834
+7.745
27.57%
1 gen 2012 anni
38.88
+3.046
8.5%
1 gen 2013 anni
40.28
+1.4
3.6%
1 gen 2014 anni
41.846
+1.566
3.89%
1 gen 2015 anni
44.244
+2.397
5.73%
Classificazione dei paesi secondo i statistiche attuali per anni