33
/it/
AIzaSyAYiBZKx7MnpbEhh9jyipgxe19OcubqV5w
May 1, 2025
71561
Armenia
ARM
true
2
1
Net official flows from UN agencies, WFP (current US$)
2013,2012,2011,2010,2009,2008,2007,2006,2005,2004,2003,2002,2001,2000,1996,1995,1994
Download
Biblioteca di statistiche globali →Armenia →

Net official flows from UN agencies, WFP (current US$)

Queste statistiche in altri paesi:

AfghanistanAlbaniaAlgeriaAngolaAntigua and BarbudaArab WorldArgentinaArmeniaAzerbaijanBangladeshBarbadosBelizeBeninBhutanBoliviaBosnia and HerzegovinaBotswanaBrazilBulgariaBurkina FasoBurundiCabo VerdeCambodiaCameroonCaribbean small statesCentral African RepublicCentral Europe and the BalticsChadChileChinaColombiaComorosCongo, Dem. Rep.Congo, Rep.Costa RicaCote d'IvoireCubaCyprusDjiboutiDominicaDominican RepublicEast Asia & PacificEast Asia & Pacific (excluding high income)East Asia & Pacific (IDA & IBRD countries)EcuadorEgypt, Arab Rep.El SalvadorEquatorial GuineaEritreaEstoniaEthiopiaEuro areaEurope & Central AsiaEurope & Central Asia (excluding high income)Europe & Central Asia (IDA & IBRD countries)European UnionFijiFragile and conflict affected situationsGabonGambia, TheGeorgiaGhanaGrenadaGuatemalaGuineaGuinea-BissauGuyanaHaitiHeavily indebted poor countries (HIPC)High incomeHondurasIBRD onlyIDA & IBRD totalIDA blendIDA onlyIDA totalIndiaIndonesiaIran, Islamic Rep.IraqJamaicaJordanKenyaKorea, Dem. People’s Rep.Korea, Rep.KuwaitKyrgyz RepublicLao PDRLatin America & Caribbean Latin America & Caribbean (excluding high income)Latin America & the Caribbean (IDA & IBRD countries)Least developed countries: UN classificationLebanonLesothoLiberiaLibyaLow & middle incomeLow incomeLower middle incomeMacedonia, FYRMadagascarMalawiMalaysiaMaldivesMaliMaltaMauritaniaMauritiusMexicoMiddle East & North AfricaMiddle East & North Africa (excluding high income)Middle East & North Africa (IDA & IBRD countries)Middle incomeMoldovaMongoliaMoroccoMozambiqueMyanmarNamibiaNepalNicaraguaNigerNigeriaOECD membersOmanOther small statesPacific island small statesPakistanPanamaPapua New GuineaParaguayPeruPhilippinesPolandRomaniaRussian FederationRwandaSamoaSao Tome and PrincipeSenegalSerbiaSeychellesSierra LeoneSingaporeSmall statesSolomon IslandsSomaliaSouth AfricaSouth AsiaSouth Asia (IDA & IBRD)South SudanSri LankaSt. Kitts and NevisSt. LuciaSt. Vincent and the GrenadinesSub-Saharan Africa Sub-Saharan Africa (excluding high income)Sub-Saharan Africa (IDA & IBRD countries)SudanSurinameSwazilandSyrian Arab RepublicTajikistanTanzaniaThailandTimor-LesteTogoTongaTrinidad and TobagoTunisiaTurkeyTurkmenistanUgandaUnited Arab EmiratesUpper middle incomeUruguayVanuatuVenezuela, RBVietnamWest Bank and GazaWorldYemen, Rep.ZambiaZimbabwe

Linea del tempo:

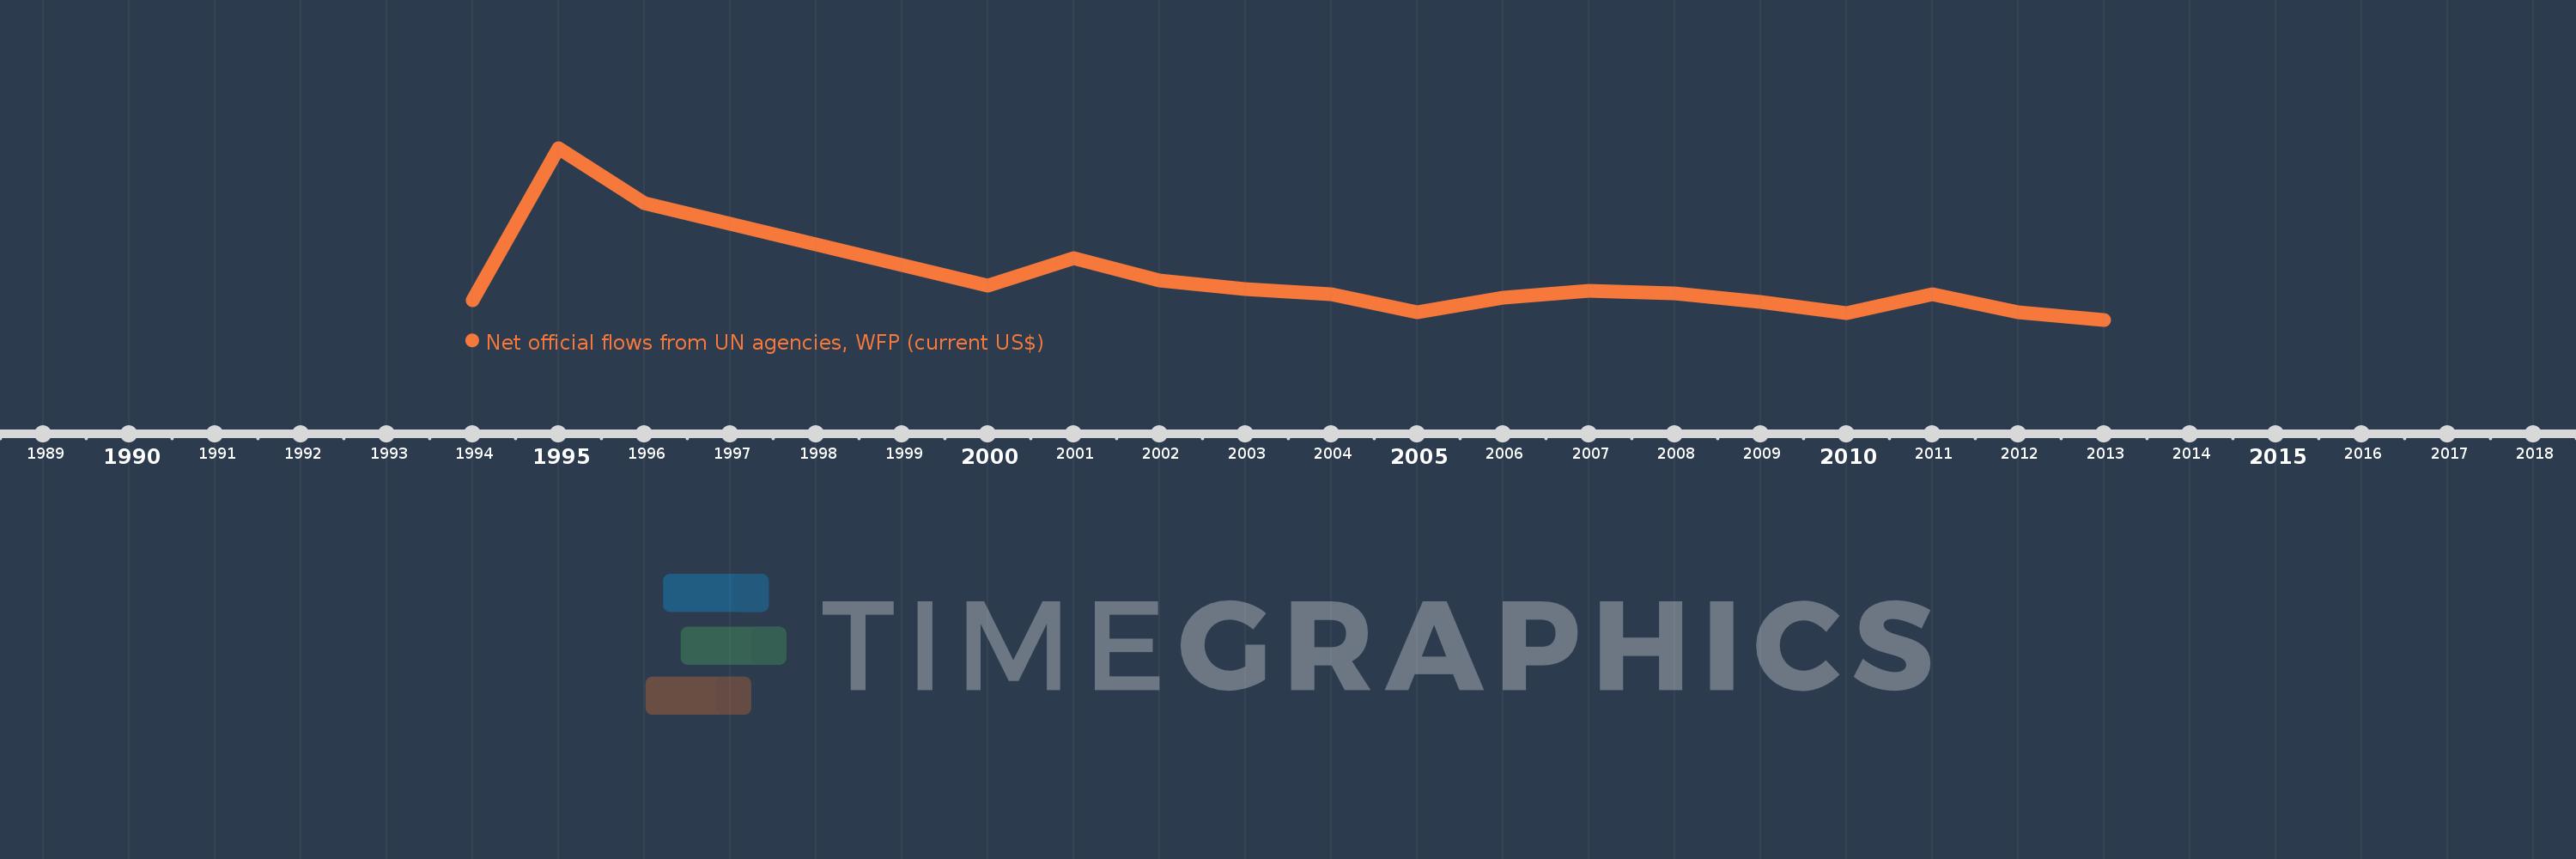
Questa scala temporale mostra un grafico dal 1994 anno al 2013 anno. Armenia. I dati fino ad 1993 anno non disponibili. Il numero di osservazioni attuali secondo i date: 17.

La fonte (nome):

Indicatori dello sviluppo mondiale

La fonte (organizzazione):

Development Assistance Committee of the Organisation for Economic Co-operation and Development, Geographical Distribution of Financial Flows to Developing Countries, Development Co-operation Report, and International Development Statistics database. Data are available online at: www.oecd.org/dac/stats/idsonline.

Categorie:

Aid Effectiveness

sono stati aggiornati

23 apr 2017 anni

Indicatori delle variazioni dei valori per anni

In media:
1.609 Mln
Minima:
0.0
1 gen 2013 anni
Massimo:
7.33 Mln
1 gen 1995 anni
Alla data di osservazione
Valore
Variazione assoluta
La variazione rispetto al valore precedente
1 gen 1994 anni
840.0 Mille.
+840.0 Mille.
0.0%
1 gen 1995 anni
7.33 Mln
+6.49 Mln
772.62%
1 gen 1996 anni
4.99 Mln
-2.34 Mln
-31.92%
1 gen 2000 anni
1.45 Mln
-3.54 Mln
-70.94%
1 gen 2001 anni
2.61 Mln
+1.16 Mln
80.0%
1 gen 2002 anni
1.66 Mln
-950.0 Mille.
-36.4%
1 gen 2003 anni
1.3 Mln
-360.0 Mille.
-21.69%
1 gen 2004 anni
1.08 Mln
-220.0 Mille.
-16.92%
1 gen 2005 anni
330.0 Mille.
-750.0 Mille.
-69.44%
1 gen 2006 anni
960.0 Mille.
+630.0 Mille.
190.91%
1 gen 2007 anni
1.24 Mln
+280.0 Mille.
29.17%
1 gen 2008 anni
1.12 Mln
-120.0 Mille.
-9.68%
1 gen 2009 anni
770.0 Mille.
-350.0 Mille.
-31.25%
1 gen 2010 anni
290.0 Mille.
-480.0 Mille.
-62.34%
1 gen 2011 anni
1.08 Mln
+790.0 Mille.
272.41%
1 gen 2012 anni
310.0 Mille.
-770.0 Mille.
-71.3%
1 gen 2013 anni
0.0
-310.0 Mille.
-100.0%

Classificazione dei paesi secondo i statistiche attuali per anni