33
/it/
AIzaSyB4mHJ5NPEv-XzF7P6NDYXjlkCWaeKw5bc
November 30, 2025
54310
Pacific island small states
PSS
false
2
1
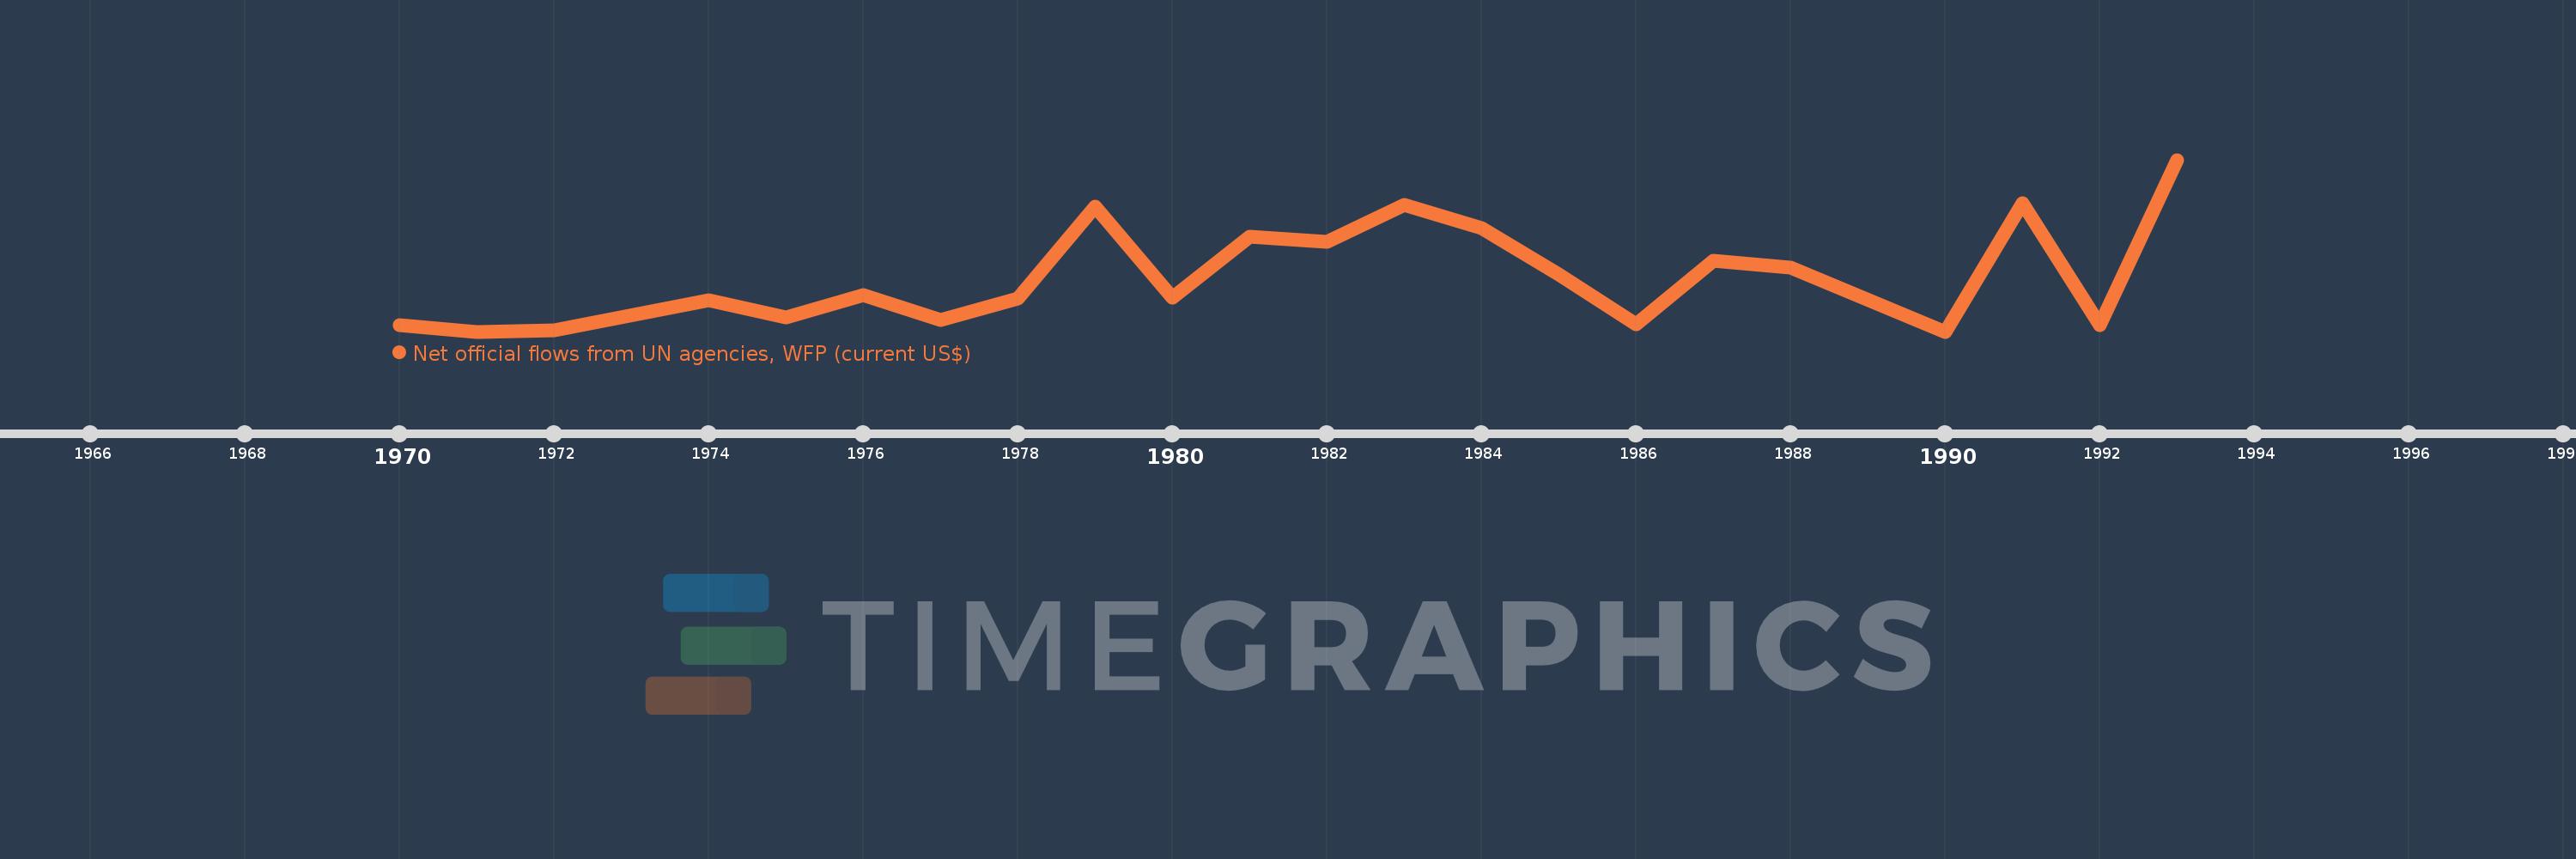
Net official flows from UN agencies, WFP (current US$)
1993,1992,1991,1990,1988,1987,1986,1985,1984,1983,1982,1981,1980,1979,1978,1977,1976,1975,1974,1972,1971,1970