29
/it/
it
AIzaSyAYiBZKx7MnpbEhh9jyipgxe19OcubqV5w
April 1, 2024
65375
Albania
ALB
true
2
1
Rail lines (total route-km)
2014,2013,2012,2011,2010,2009,2008,2007,2006,2005,2004,2003,2002,1998,1996,1995,1994,1993,1986,1981
Download
Biblioteca di statistiche globali →Albania →

Rail lines (total route-km)

Queste statistiche in altri paesi:
AlbaniaAlgeriaArab WorldArgentinaArmeniaAustraliaAustriaAzerbaijanBangladeshBelarusBelgiumBeninBoliviaBosnia and HerzegovinaBotswanaBrazilBulgariaBurkina FasoCambodiaCameroonCanadaCentral Europe and the BalticsChileChinaColombiaCongo, Dem. Rep.Congo, Rep.Costa RicaCote d'IvoireCroatiaCubaCzech RepublicDenmarkDjiboutiEarly-demographic dividendEast Asia & PacificEast Asia & Pacific (excluding high income)East Asia & Pacific (IDA & IBRD countries)Egypt, Arab Rep.EstoniaEthiopiaEuro areaEurope & Central AsiaEurope & Central Asia (excluding high income)Europe & Central Asia (IDA & IBRD countries)European UnionFinlandFragile and conflict affected situationsFranceGabonGeorgiaGermanyGhanaGreeceHeavily indebted poor countries (HIPC)High incomeHungaryIBRD onlyIDA & IBRD totalIDA blendIDA onlyIDA totalIndiaIndonesiaIran, Islamic Rep.IraqIrelandIsraelItalyJapanJordanKazakhstanKenyaKorea, Rep.Kyrgyz RepublicLate-demographic dividendLatin America & Caribbean Latin America & Caribbean (excluding high income)Latin America & the Caribbean (IDA & IBRD countries)LatviaLeast developed countries: UN classificationLithuaniaLow & middle incomeLow incomeLower middle incomeLuxembourgMacedonia, FYRMadagascarMalawiMalaysiaMaliMauritaniaMexicoMiddle East & North AfricaMiddle East & North Africa (excluding high income)Middle East & North Africa (IDA & IBRD countries)Middle incomeMoldovaMongoliaMoroccoMozambiqueMyanmarNamibiaNetherlandsNew ZealandNigeriaNorth AmericaNorwayOECD membersOther small statesPakistanPeruPhilippinesPolandPortugalPost-demographic dividendPre-demographic dividendRomaniaRussian FederationSaudi ArabiaSenegalSerbiaSlovak RepublicSloveniaSmall statesSouth AfricaSouth AsiaSouth Asia (IDA & IBRD)SpainSri LankaSub-Saharan Africa Sub-Saharan Africa (excluding high income)Sub-Saharan Africa (IDA & IBRD countries)SudanSwazilandSwedenSwitzerlandSyrian Arab RepublicTajikistanTanzaniaThailandTunisiaTurkeyTurkmenistanUgandaUkraineUnited KingdomUnited StatesUpper middle incomeUruguayUzbekistanVenezuela, RBVietnamWorldZambiaZimbabwe
Linea del tempo:
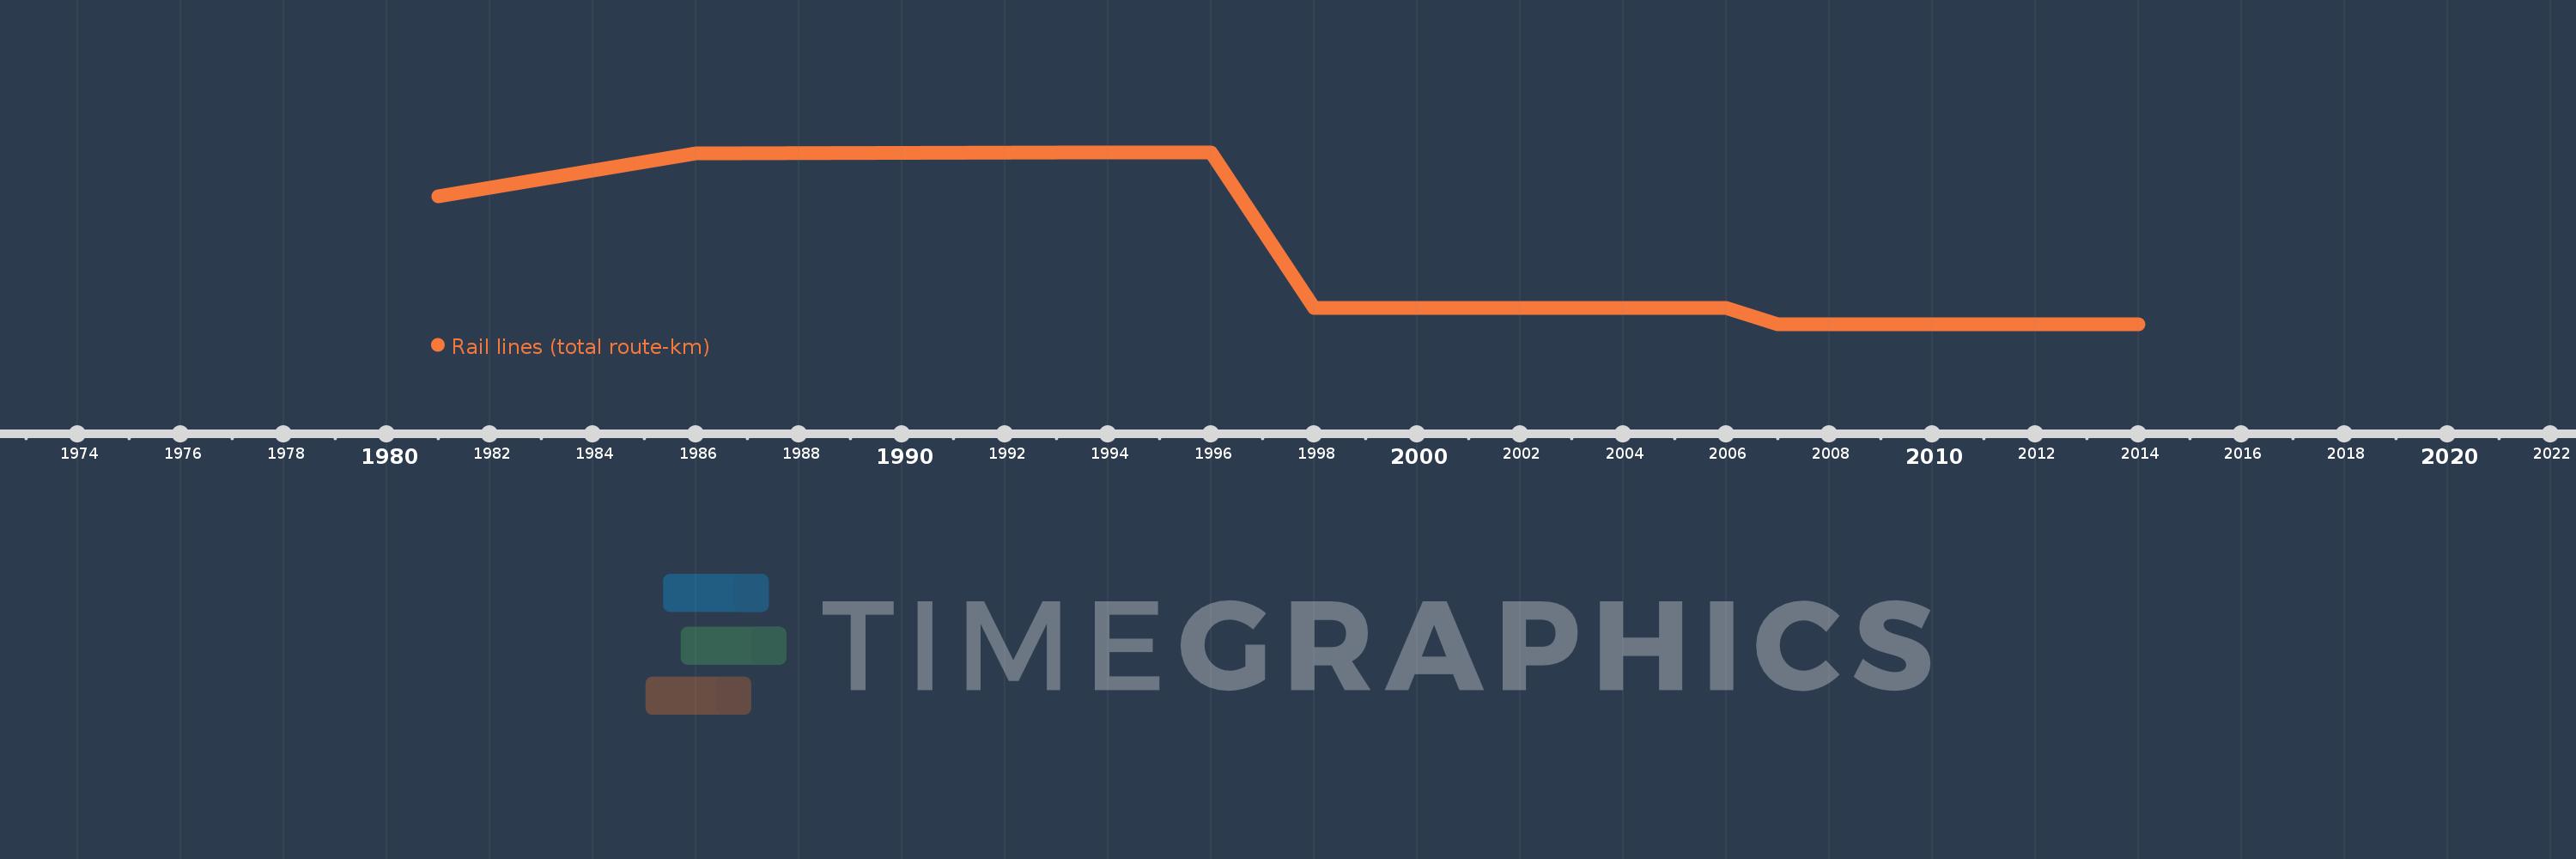
Questa scala temporale mostra un grafico dal 1981 anno al 2014 anno. Albania. I dati fino ad 1980 anno non disponibili. Il numero di osservazioni attuali secondo i date: 20.
La fonte (nome):
Indicatori dello sviluppo mondiale
La fonte (organizzazione):
World Bank, Transportation, Water, and Information and Communications Technologies Department, Transport Division.
Categorie:
Infrastructure
sono stati aggiornati
23 apr 2017 anni
Indicatori delle variazioni dei valori per anni
In media:
502.2
Minima:
423.0
1 gen 2007 anni
Massimo:
674.0
1 gen 1993 anni
Alla data di osservazione
Valore
Variazione assoluta
La variazione rispetto al valore precedente
1 gen 1981 anni
610.0
+610.0
0.0%
1 gen 1986 anni
672.0
+62.0
10.16%
1 gen 1993 anni
674.0
+2.0
0.3%
1 gen 1994 anni
674.0
0.0
0.0%
1 gen 1995 anni
674.0
0.0
0.0%
1 gen 1996 anni
674.0
0.0
0.0%
1 gen 1998 anni
447.0
-227.0
-33.68%
1 gen 2002 anni
447.0
0.0
0.0%
1 gen 2003 anni
447.0
0.0
0.0%
1 gen 2004 anni
447.0
0.0
0.0%
1 gen 2005 anni
447.0
0.0
0.0%
1 gen 2006 anni
447.0
0.0
0.0%
1 gen 2007 anni
423.0
-24.0
-5.37%
1 gen 2008 anni
423.0
0.0
0.0%
1 gen 2009 anni
423.0
0.0
0.0%
1 gen 2010 anni
423.0
0.0
0.0%
1 gen 2011 anni
423.0
0.0
0.0%
1 gen 2012 anni
423.0
0.0
0.0%
1 gen 2013 anni
423.0
0.0
0.0%
1 gen 2014 anni
423.0
0.0
0.0%
Classificazione dei paesi secondo i statistiche attuali per anni

Commenti:

Inviare
PremiumAbout & FeedbackAccordoPrivatezza
logo
© 2022 Selected Technologies LLC – Morgan Hill, California