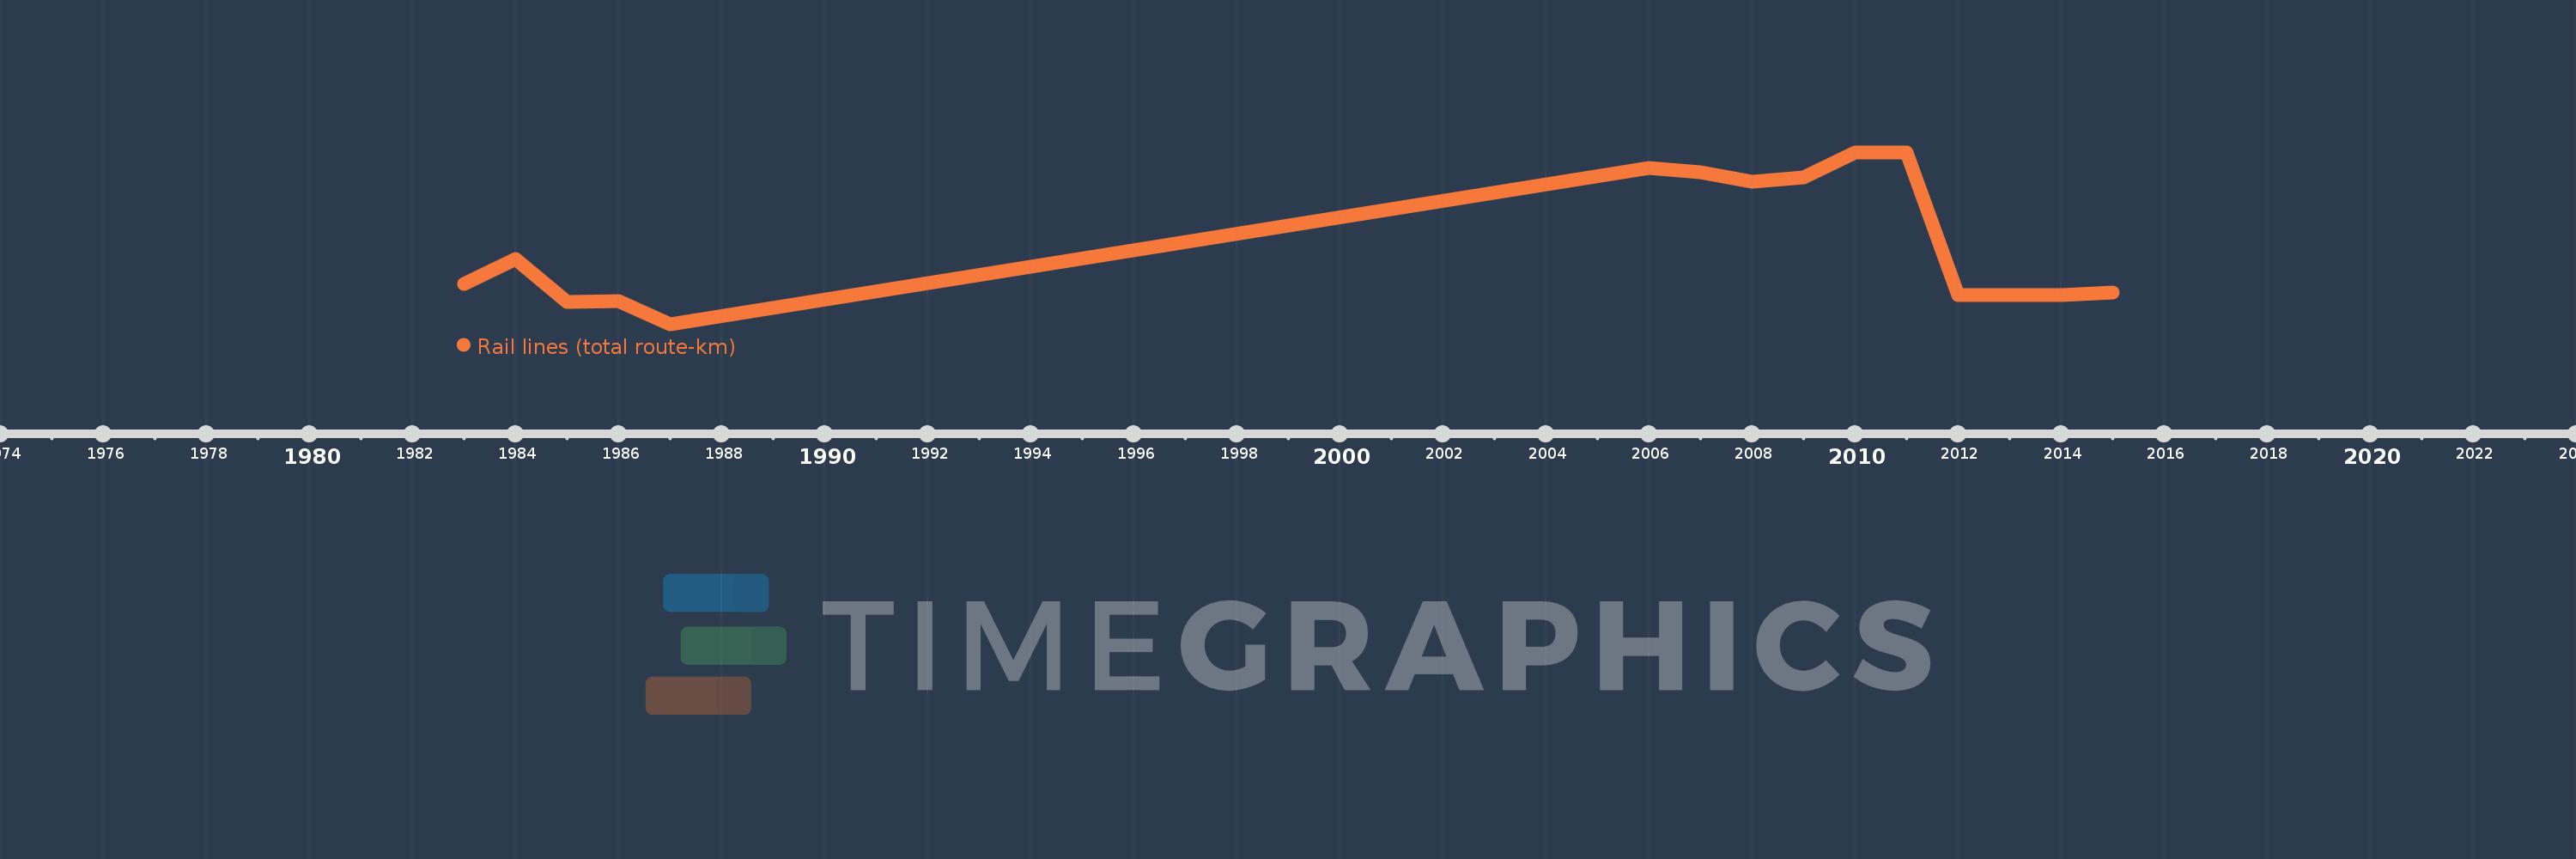
Questa scala temporale mostra un grafico dal 1983 anno al 2015 anno. Canada. I dati fino ad 1982 anno non disponibili. Il numero di osservazioni attuali secondo i date: 15.
La fonte (nome):
Indicatori dello sviluppo mondiale
La fonte (organizzazione):
World Bank, Transportation, Water, and Information and Communications Technologies Department, Transport Division.
Categorie:
Infrastructure
sono stati aggiornati
23 apr 2017 anni
Indicatori delle variazioni dei valori per anni
In media:
54.3 Mille.
Minima:
50.708 Mille.
1 gen 1987 anni
Massimo:
58.345 Mille.
1 gen 2010 anni
Alla data di osservazione
Valore
Variazione assoluta
La variazione rispetto al valore precedente
1 gen 1983 anni
52.507 Mille.
+52.507 Mille.
0.0%
1 gen 1984 anni
53.605 Mille.
+1.098 Mille.
2.09%
1 gen 1985 anni
51.697 Mille.
-1.908 Mille.
-3.56%
1 gen 1986 anni
51.745 Mille.
+48.0
0.09%
1 gen 1987 anni
50.708 Mille.
-1.037 Mille.
-2.0%
1 gen 2006 anni
57.671 Mille.
+6.963 Mille.
13.73%
1 gen 2007 anni
57.481 Mille.
-190.0
-0.33%
1 gen 2008 anni
57.042 Mille.
-439.0
-0.76%
1 gen 2009 anni
57.216 Mille.
+174.0
0.31%
1 gen 2010 anni
58.345 Mille.
+1.129 Mille.
1.97%
1 gen 2011 anni
58.345 Mille.
0.0
0.0%
1 gen 2012 anni
52.002 Mille.
-6.343 Mille.
-10.87%
1 gen 2013 anni
52.002 Mille.
0.0
0.0%
1 gen 2014 anni
52.002 Mille.
0.0
0.0%
1 gen 2015 anni
52.131 Mille.
+129.0
0.25%
Classificazione dei paesi secondo i statistiche attuali per anni