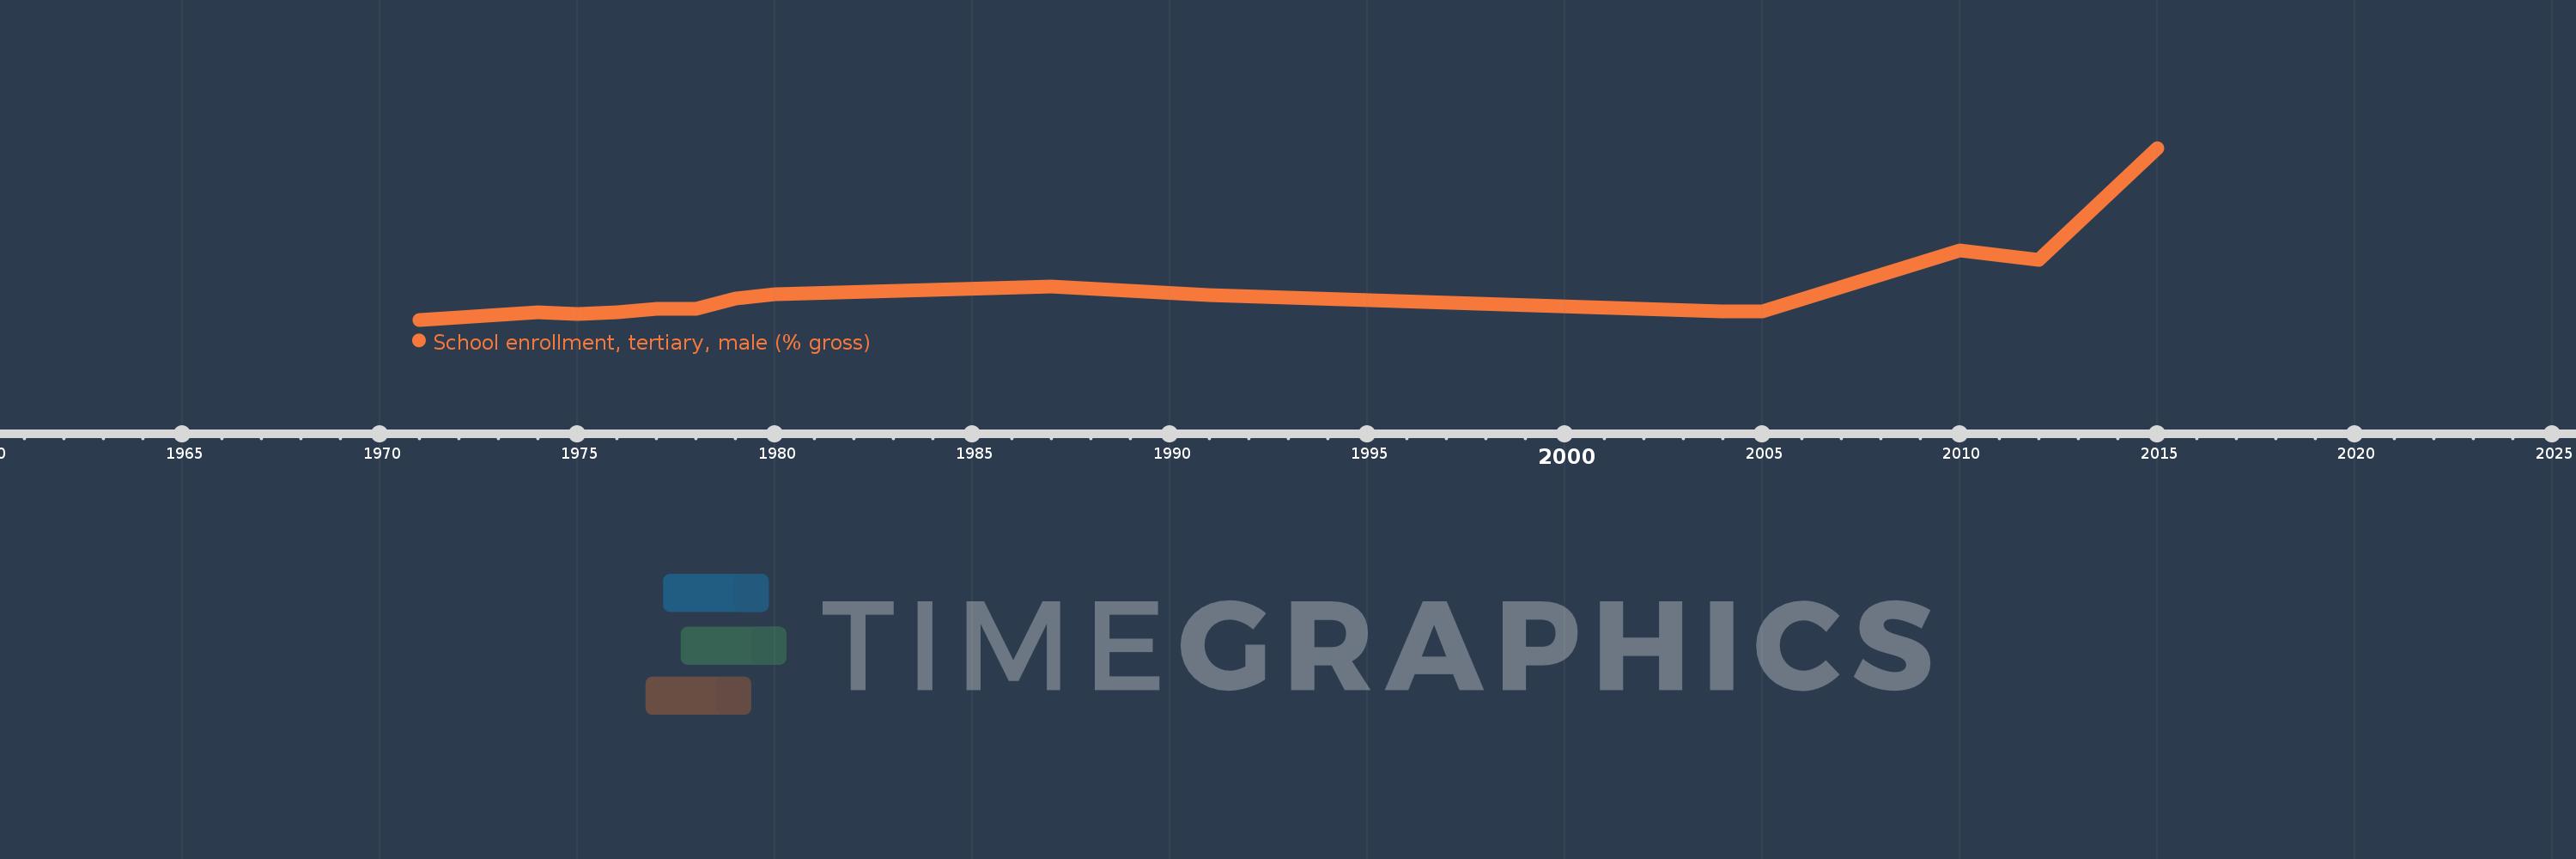
Questa scala temporale mostra un grafico dal 1971 anno al 2015 anno. Afghanistan. I dati fino ad 1970 anno non disponibili. Il numero di osservazioni attuali secondo i date: 16.
La fonte (nome):
Indicatori dello sviluppo mondiale
La fonte (organizzazione):
United Nations Educational, Scientific, and Cultural Organization (UNESCO) Institute for Statistics.
Categorie:
Education, Gender
sono stati aggiornati
23 apr 2017 anni
Indicatori delle variazioni dei valori per anni
In media:
3.375
Minima:
1.336
1 gen 1971 anni
Massimo:
13.287
1 gen 2015 anni
Alla data di osservazione
Valore
Variazione assoluta
La variazione rispetto al valore precedente
1 gen 1971 anni
1.336
+1.336
0.0%
1 gen 1973 anni
1.652
+0.316
23.65%
1 gen 1974 anni
1.84
+0.188
11.38%
1 gen 1975 anni
1.747
-0.094
-5.09%
1 gen 1976 anni
1.828
+0.081
4.66%
1 gen 1977 anni
2.07
+0.241
13.21%
1 gen 1978 anni
2.123
+0.054
2.59%
1 gen 1979 anni
2.79
+0.667
31.42%
1 gen 1980 anni
3.128
+0.337
12.09%
1 gen 1987 anni
3.672
+0.544
17.41%
1 gen 1991 anni
3.037
-0.636
-17.31%
1 gen 2004 anni
1.91
-1.127
-37.1%
1 gen 2005 anni
1.913
+0.003
0.18%
1 gen 2010 anni
6.186
+4.273
223.31%
1 gen 2012 anni
5.488
-0.698
-11.29%
1 gen 2015 anni
13.287
+7.799
142.11%
Classificazione dei paesi secondo i statistiche attuali per anni