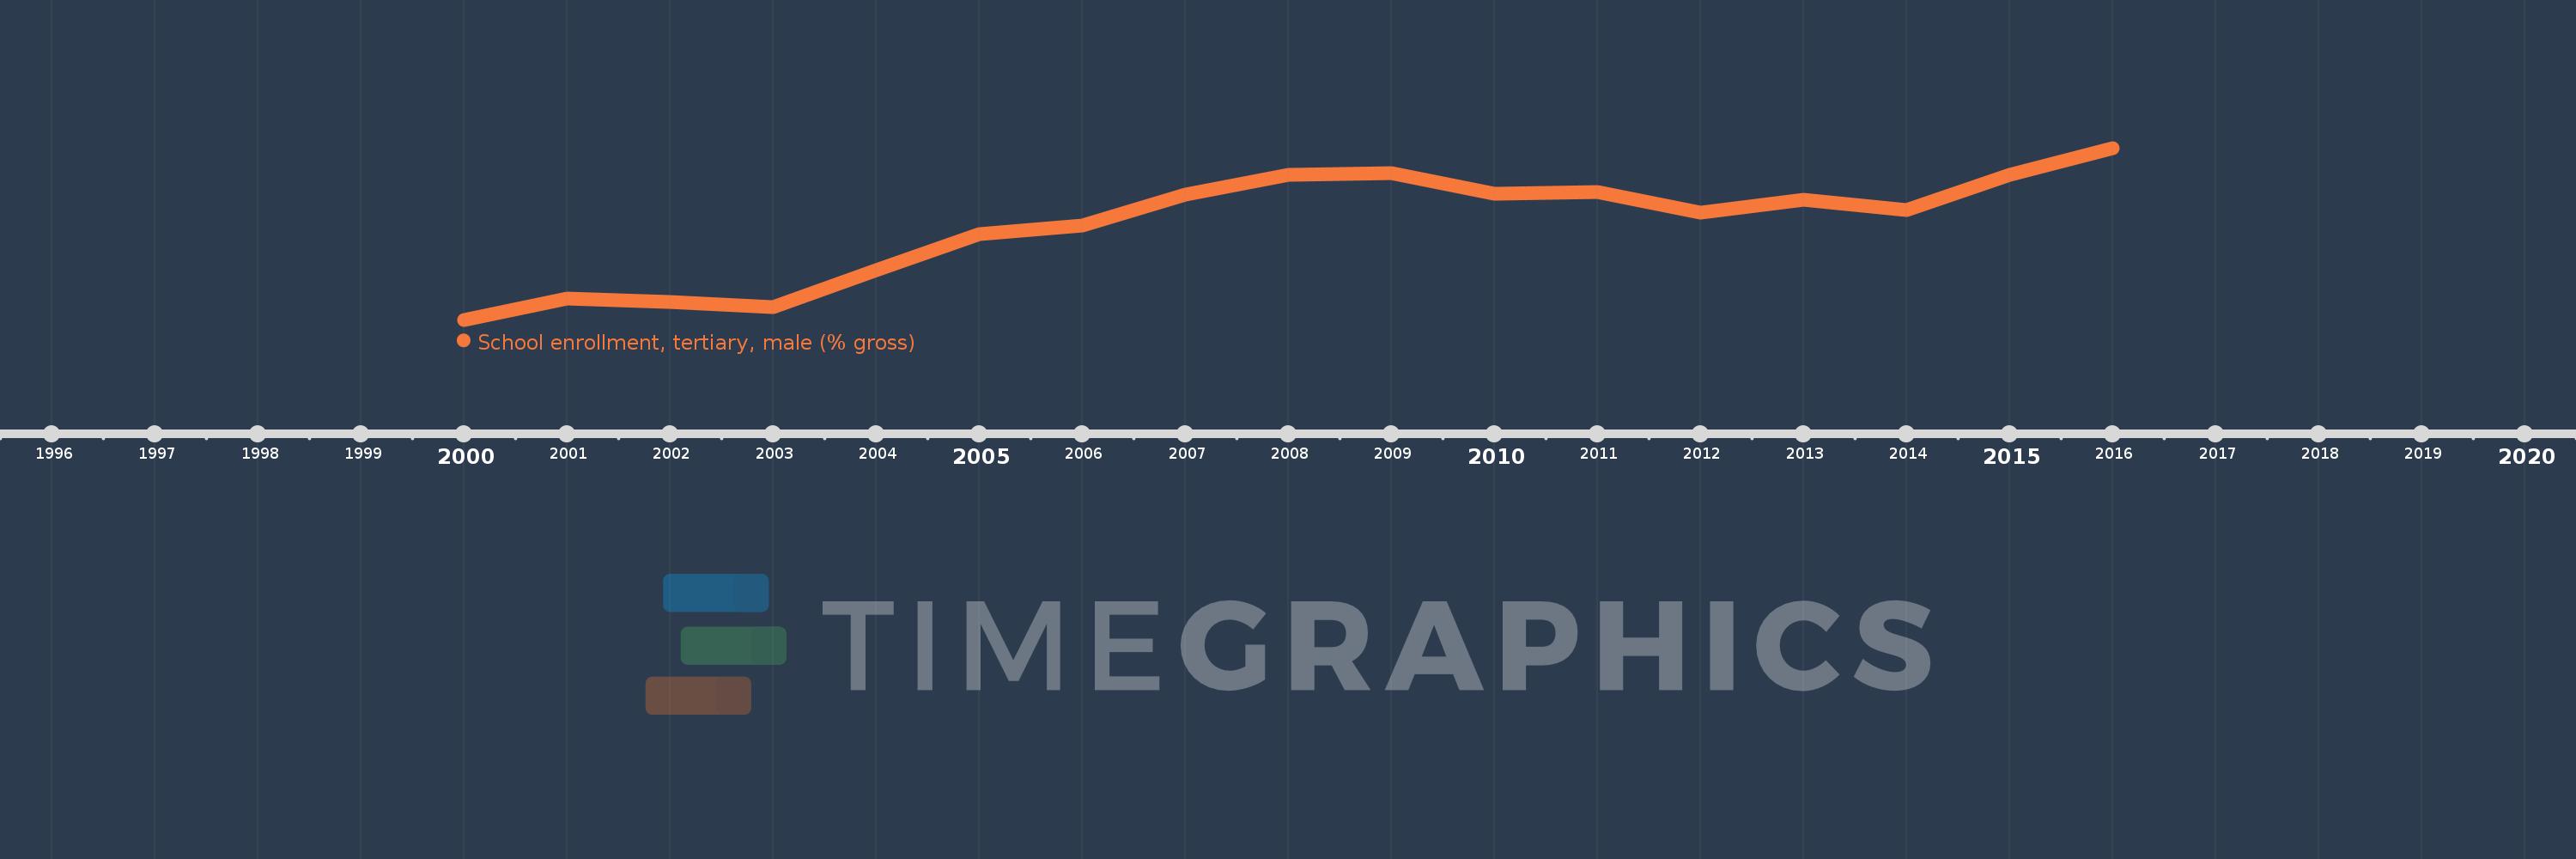
Questa scala temporale mostra un grafico dal 2000 anno al 2016 anno. Tajikistan. I dati fino ad 1999 anno non disponibili. Il numero di osservazioni attuali secondo i date: 17.
La fonte (nome):
Indicatori dello sviluppo mondiale
La fonte (organizzazione):
United Nations Educational, Scientific, and Cultural Organization (UNESCO) Institute for Statistics.
Categorie:
Education, Gender
sono stati aggiornati
23 apr 2017 anni
Indicatori delle variazioni dei valori per anni
In media:
28.266
Minima:
24.314
1 gen 2000 anni
Massimo:
31.504
1 gen 2016 anni
Alla data di osservazione
Valore
Variazione assoluta
La variazione rispetto al valore precedente
1 gen 2000 anni
24.314
+24.314
0.0%
1 gen 2001 anni
25.191
+0.876
3.6%
1 gen 2002 anni
25.073
-0.118
-0.47%
1 gen 2003 anni
24.841
-0.232
-0.93%
1 gen 2004 anni
26.403
+1.562
6.29%
1 gen 2005 anni
27.897
+1.494
5.66%
1 gen 2006 anni
28.255
+0.358
1.28%
1 gen 2007 anni
29.539
+1.285
4.55%
1 gen 2008 anni
30.384
+0.844
2.86%
1 gen 2009 anni
30.435
+0.051
0.17%
1 gen 2010 anni
29.58
-0.855
-2.81%
1 gen 2011 anni
29.662
+0.083
0.28%
1 gen 2012 anni
28.809
-0.854
-2.88%
1 gen 2013 anni
29.334
+0.526
1.82%
1 gen 2014 anni
28.92
-0.415
-1.41%
1 gen 2015 anni
30.378
+1.458
5.04%
1 gen 2016 anni
31.504
+1.126
3.71%
Classificazione dei paesi secondo i statistiche attuali per anni