33
/it/
AIzaSyB4mHJ5NPEv-XzF7P6NDYXjlkCWaeKw5bc
November 30, 2025
60825
Sub-Saharan Africa (IDA & IBRD countries)
TSS
false
2
1
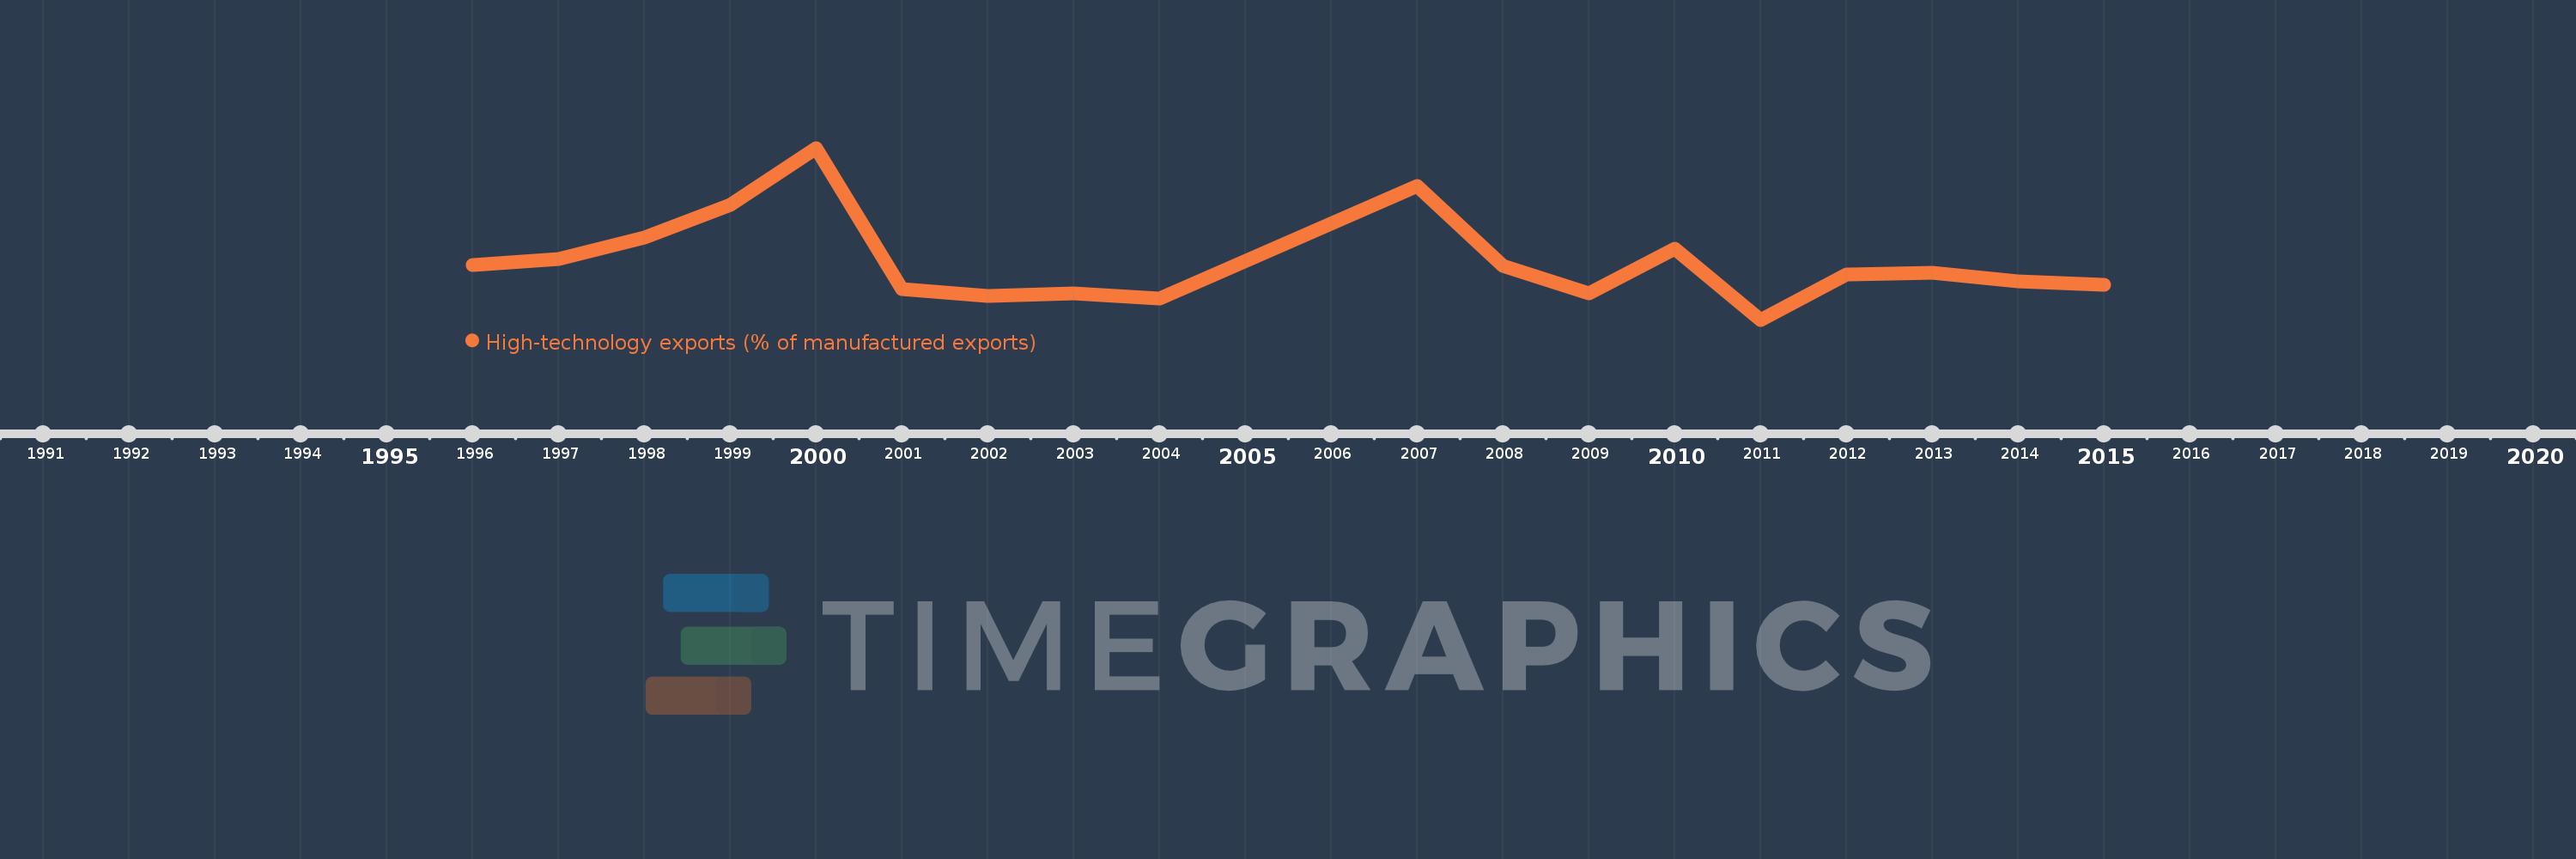
High-technology exports (% of manufactured exports)
2015,2014,2013,2012,2011,2010,2009,2008,2007,2004,2003,2002,2001,2000,1999,1998,1997,1996