33
/it/
AIzaSyAYiBZKx7MnpbEhh9jyipgxe19OcubqV5w
August 1, 2025
56281
Small states
SST
false
2
1
High-technology exports (% of manufactured exports)
2016,2015,2014,2012,2011,2010,2009,2008,2007,2006,2005,2004,2003,2002,2001,2000,1999,1997,1995
Download
Biblioteca di statistiche globali →Small states →

High-technology exports (% of manufactured exports)

Queste statistiche in altri paesi:

AlbaniaAlgeriaAndorraAntigua and BarbudaArab WorldArgentinaArmeniaArubaAustraliaAustriaAzerbaijanBahamas, TheBahrainBangladeshBarbadosBelarusBelgiumBelizeBeninBermudaBhutanBoliviaBosnia and HerzegovinaBotswanaBrazilBrunei DarussalamBulgariaBurkina FasoBurundiCabo VerdeCambodiaCameroonCanadaCaribbean small statesCentral African RepublicCentral Europe and the BalticsChileChinaColombiaComorosCongo, Rep.Costa RicaCote d'IvoireCroatiaCubaCyprusCzech RepublicDenmarkDjiboutiDominicaDominican RepublicEarly-demographic dividendEast Asia & PacificEast Asia & Pacific (excluding high income)East Asia & Pacific (IDA & IBRD countries)EcuadorEgypt, Arab Rep.El SalvadorEritreaEstoniaEthiopiaEuro areaEurope & Central AsiaEurope & Central Asia (excluding high income)Europe & Central Asia (IDA & IBRD countries)European UnionFaroe IslandsFijiFinlandFragile and conflict affected situationsFranceFrench PolynesiaGabonGambia, TheGeorgiaGermanyGhanaGreeceGreenlandGrenadaGuatemalaGuineaGuinea-BissauGuyanaHaitiHeavily indebted poor countries (HIPC)High incomeHondurasHong Kong SAR, ChinaHungaryIBRD onlyIcelandIDA & IBRD totalIDA blendIDA onlyIDA totalIndiaIndonesiaIran, Islamic Rep.IraqIrelandIsraelItalyJamaicaJapanJordanKazakhstanKenyaKiribatiKorea, Rep.KuwaitKyrgyz RepublicLate-demographic dividendLatin America & Caribbean Latin America & Caribbean (excluding high income)Latin America & the Caribbean (IDA & IBRD countries)LatviaLebanonLesothoLithuaniaLow & middle incomeLow incomeLower middle incomeLuxembourgMacao SAR, ChinaMacedonia, FYRMadagascarMalawiMalaysiaMaldivesMaliMaltaMauritiusMexicoMiddle East & North AfricaMiddle East & North Africa (excluding high income)Middle East & North Africa (IDA & IBRD countries)Middle incomeMoldovaMongoliaMoroccoMozambiqueMyanmarNamibiaNepalNetherlandsNew CaledoniaNew ZealandNicaraguaNigerNigeriaNorth AmericaNorwayOECD membersOmanOther small statesPacific island small statesPakistanPalauPanamaPapua New GuineaParaguayPeruPhilippinesPolandPortugalPost-demographic dividendPre-demographic dividendQatarRomaniaRussian FederationRwandaSamoaSao Tome and PrincipeSaudi ArabiaSenegalSerbiaSeychellesSierra LeoneSingaporeSlovak RepublicSloveniaSmall statesSolomon IslandsSouth AfricaSouth AsiaSouth Asia (IDA & IBRD)SpainSri LankaSt. Kitts and NevisSt. LuciaSt. Vincent and the GrenadinesSub-Saharan Africa Sub-Saharan Africa (excluding high income)Sub-Saharan Africa (IDA & IBRD countries)SudanSurinameSwazilandSwedenSwitzerlandSyrian Arab RepublicTajikistanTanzaniaThailandTimor-LesteTogoTongaTrinidad and TobagoTunisiaTurkeyTurkmenistanTurks and Caicos IslandsTuvaluUgandaUkraineUnited Arab EmiratesUnited KingdomUnited StatesUpper middle incomeUruguayVanuatuVenezuela, RBVietnamWorldYemen, Rep.ZambiaZimbabwe

Linea del tempo:

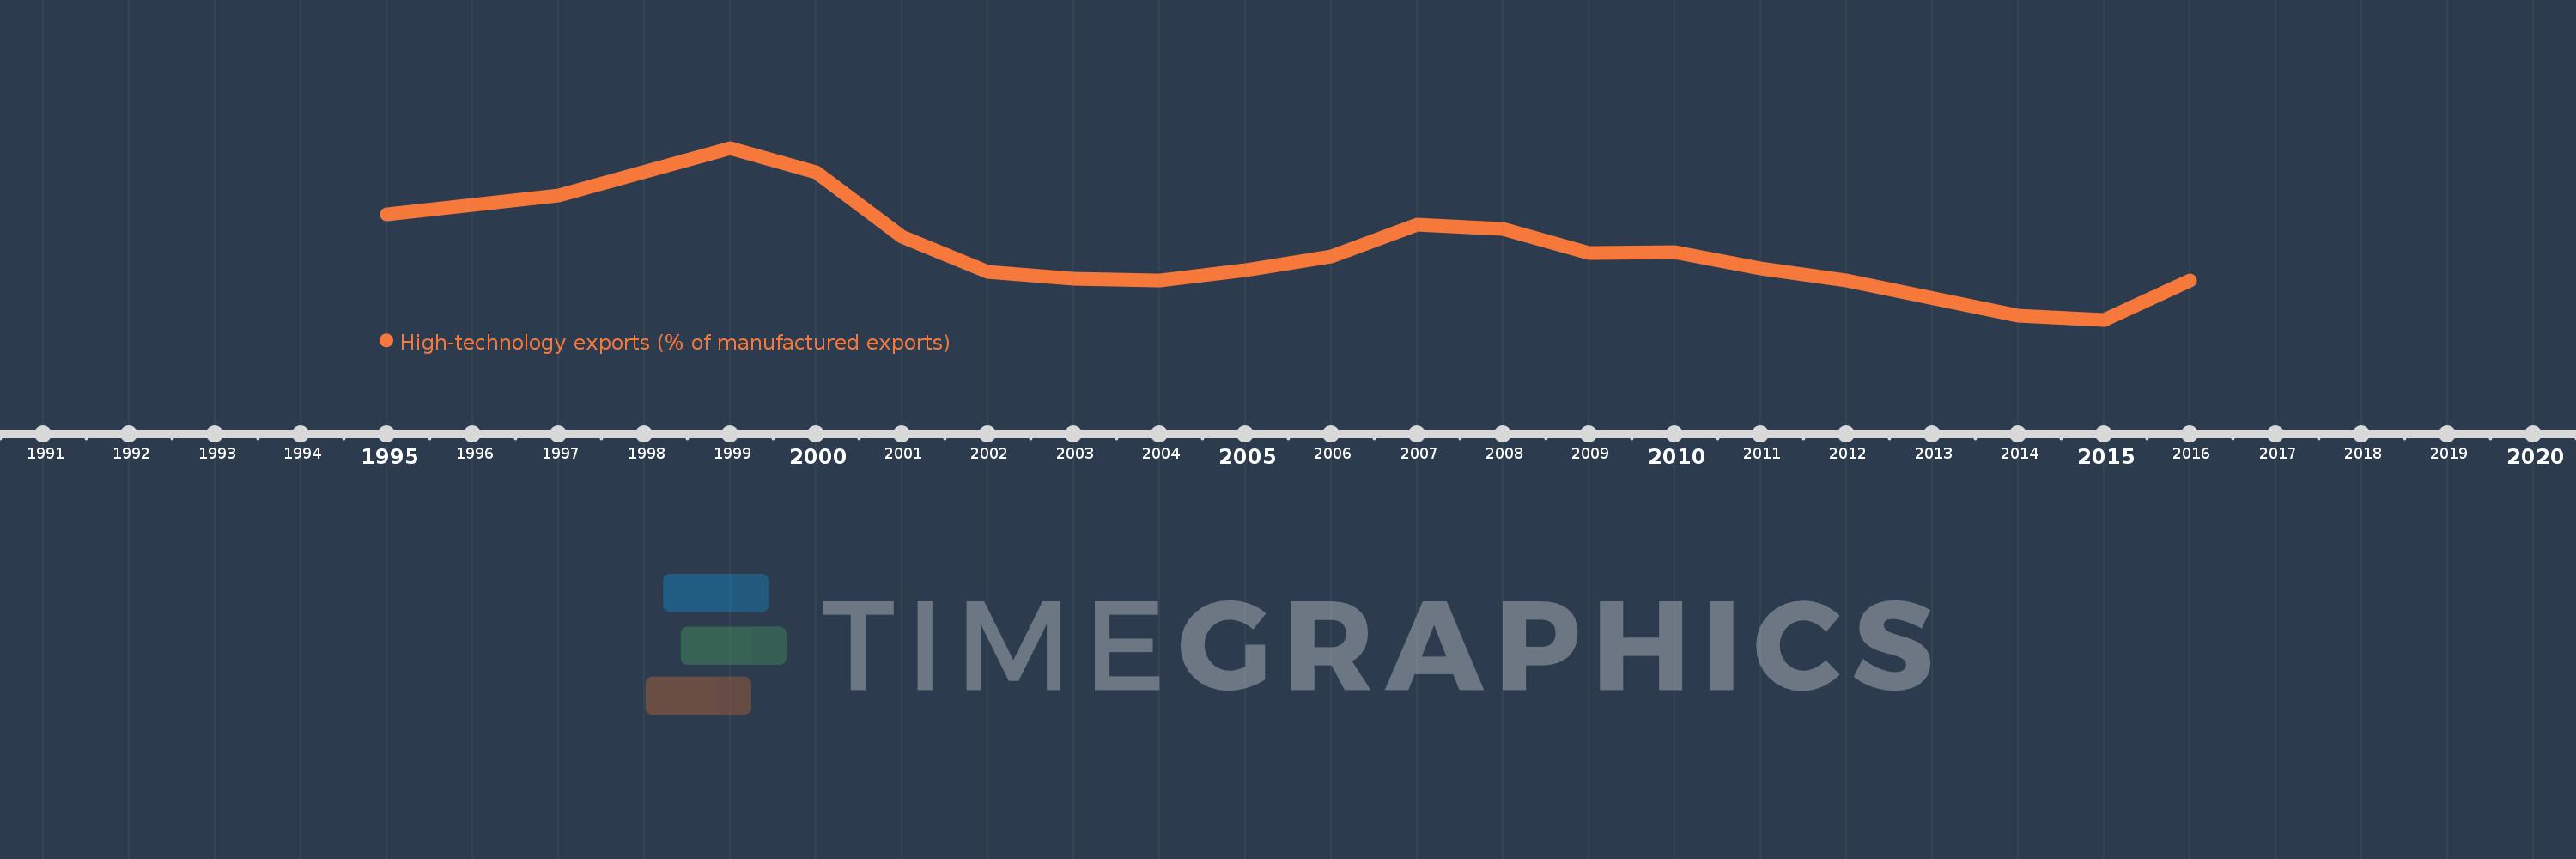
Questa scala temporale mostra un grafico dal 1995 anno al 2016 anno. Small states. I dati fino ad 1994 anno non disponibili. Il numero di osservazioni attuali secondo i date: 19.

La fonte (nome):

Indicatori dello sviluppo mondiale

La fonte (organizzazione):

United Nations, Comtrade database.

Categorie:

Private Sector, Science & Technology, Trade

sono stati aggiornati

23 apr 2017 anni

Indicatori delle variazioni dei valori per anni

In media:
8.882
Minima:
4.594
1 gen 2015 anni
Massimo:
15.14
1 gen 1999 anni
Alla data di osservazione
Valore
Variazione assoluta
La variazione rispetto al valore precedente
1 gen 1995 anni
11.057
+11.057
0.0%
1 gen 1997 anni
12.239
+1.182
10.69%
1 gen 1999 anni
15.14
+2.901
23.71%
1 gen 2000 anni
13.65
-1.49
-9.84%
1 gen 2001 anni
9.672
-3.978
-29.14%
1 gen 2002 anni
7.554
-2.118
-21.9%
1 gen 2003 anni
7.119
-0.435
-5.76%
1 gen 2004 anni
7.004
-0.115
-1.61%
1 gen 2005 anni
7.63
+0.625
8.93%
1 gen 2006 anni
8.488
+0.858
11.24%
1 gen 2007 anni
10.41
+1.923
22.65%
1 gen 2008 anni
10.149
-0.261
-2.51%
1 gen 2009 anni
8.685
-1.464
-14.43%
1 gen 2010 anni
8.759
+0.074
0.85%
1 gen 2011 anni
7.732
-1.027
-11.73%
1 gen 2012 anni
7.01
-0.722
-9.34%
1 gen 2014 anni
4.868
-2.141
-30.55%
1 gen 2015 anni
4.594
-0.274
-5.64%
1 gen 2016 anni
6.996
+2.402
52.28%

Classificazione dei paesi secondo i statistiche attuali per anni