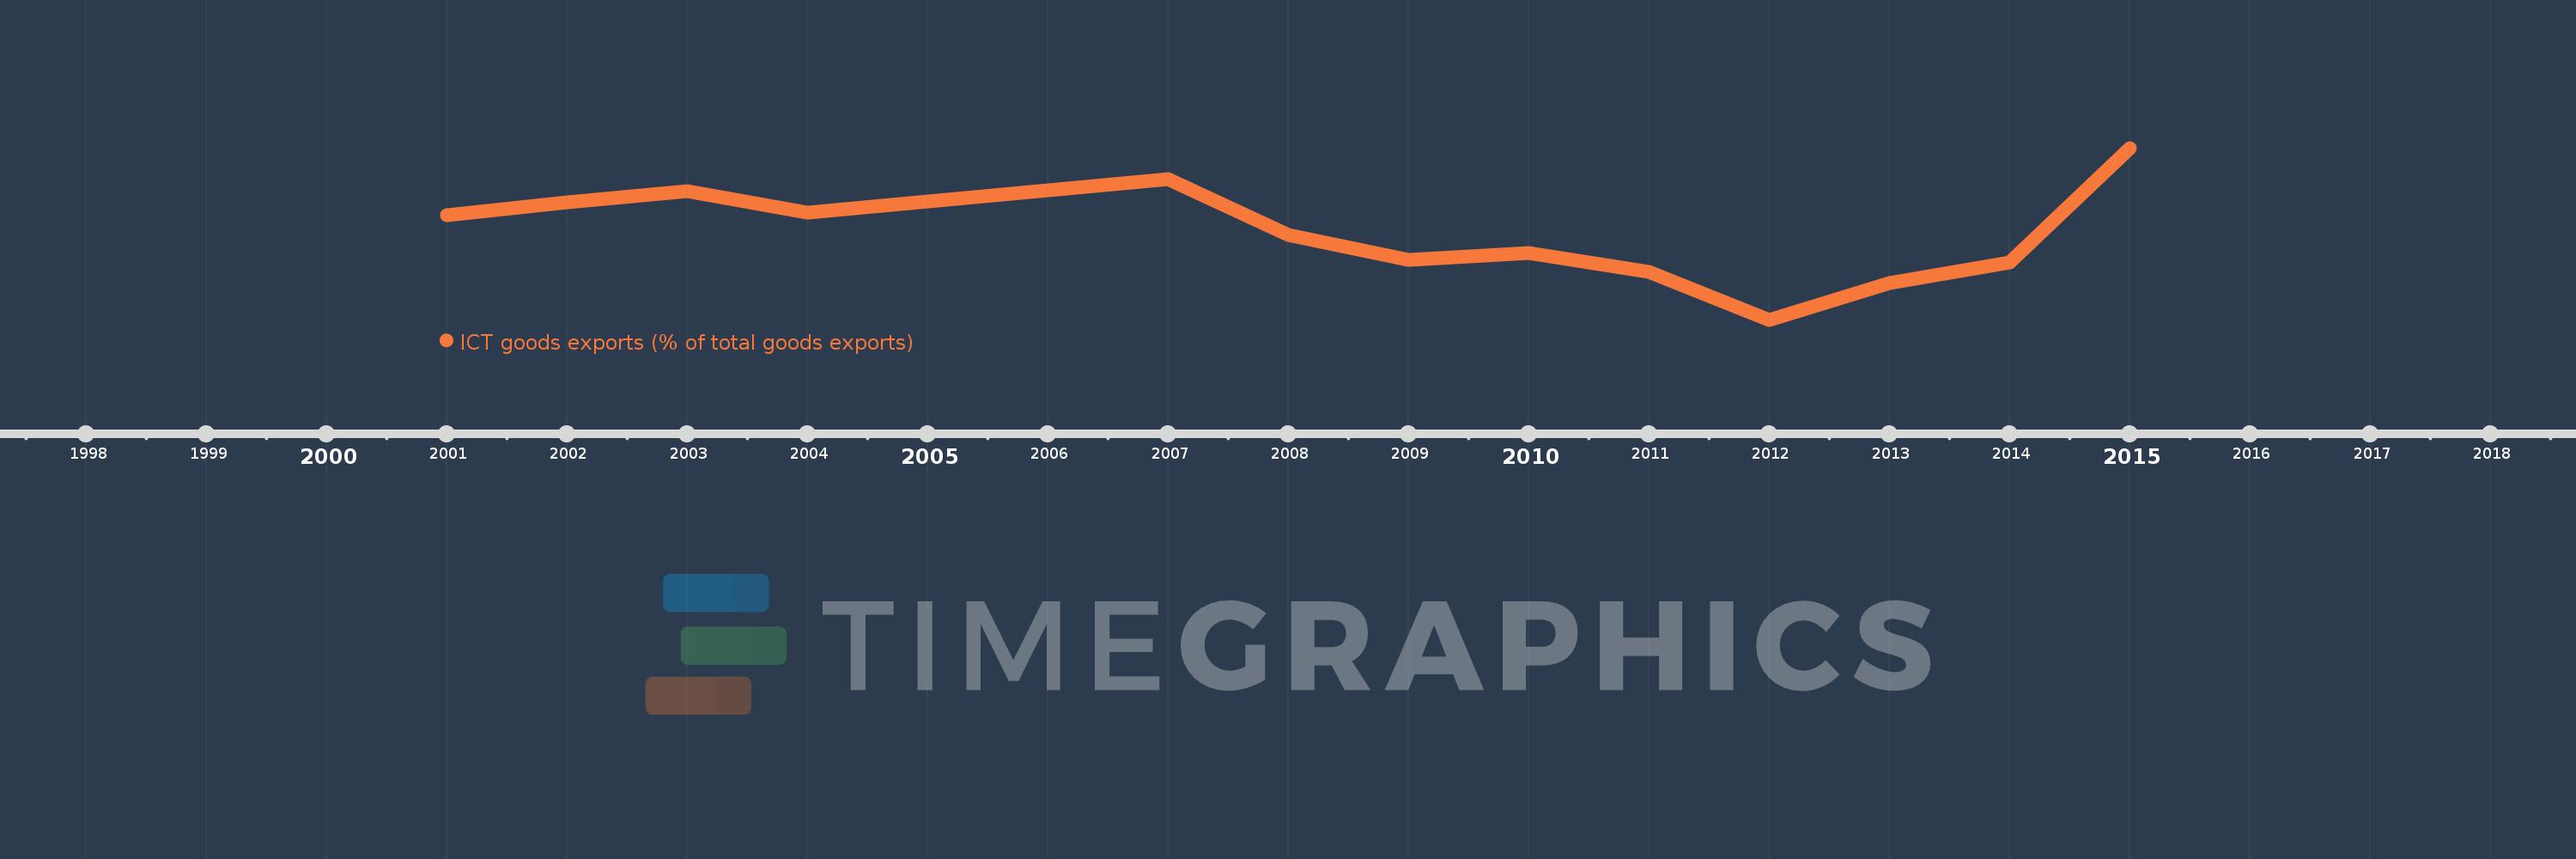
Questa scala temporale mostra un grafico dal 2001 anno al 2015 anno. Sub-Saharan Africa (excluding high income). I dati fino ad 2000 anno non disponibili. Il numero di osservazioni attuali secondo i date: 13.
La fonte (nome):
Indicatori dello sviluppo mondiale
La fonte (organizzazione):
United Nations Conference on Trade and Development's UNCTADstat database at http://unctadstat.unctad.org/ReportFolders/reportFolders.aspx.
Categorie:
Infrastructure, Private Sector, Trade
sono stati aggiornati
23 apr 2017 anni
Indicatori delle variazioni dei valori per anni
In media:
0.596
Minima:
0.43
1 gen 2012 anni
Massimo:
0.761
1 gen 2015 anni
Alla data di osservazione
Valore
Variazione assoluta
La variazione rispetto al valore precedente
1 gen 2001 anni
0.631
+0.631
0.0%
1 gen 2002 anni
0.656
+0.025
3.91%
1 gen 2003 anni
0.678
+0.023
3.43%
1 gen 2004 anni
0.637
-0.041
-6.0%
1 gen 2007 anni
0.701
+0.063
9.91%
1 gen 2008 anni
0.594
-0.107
-15.24%
1 gen 2009 anni
0.546
-0.048
-8.07%
1 gen 2010 anni
0.558
+0.012
2.25%
1 gen 2011 anni
0.522
-0.036
-6.52%
1 gen 2012 anni
0.43
-0.092
-17.56%
1 gen 2013 anni
0.5
+0.069
16.12%
1 gen 2014 anni
0.54
+0.04
8.02%
1 gen 2015 anni
0.761
+0.222
41.08%
Classificazione dei paesi secondo i statistiche attuali per anni