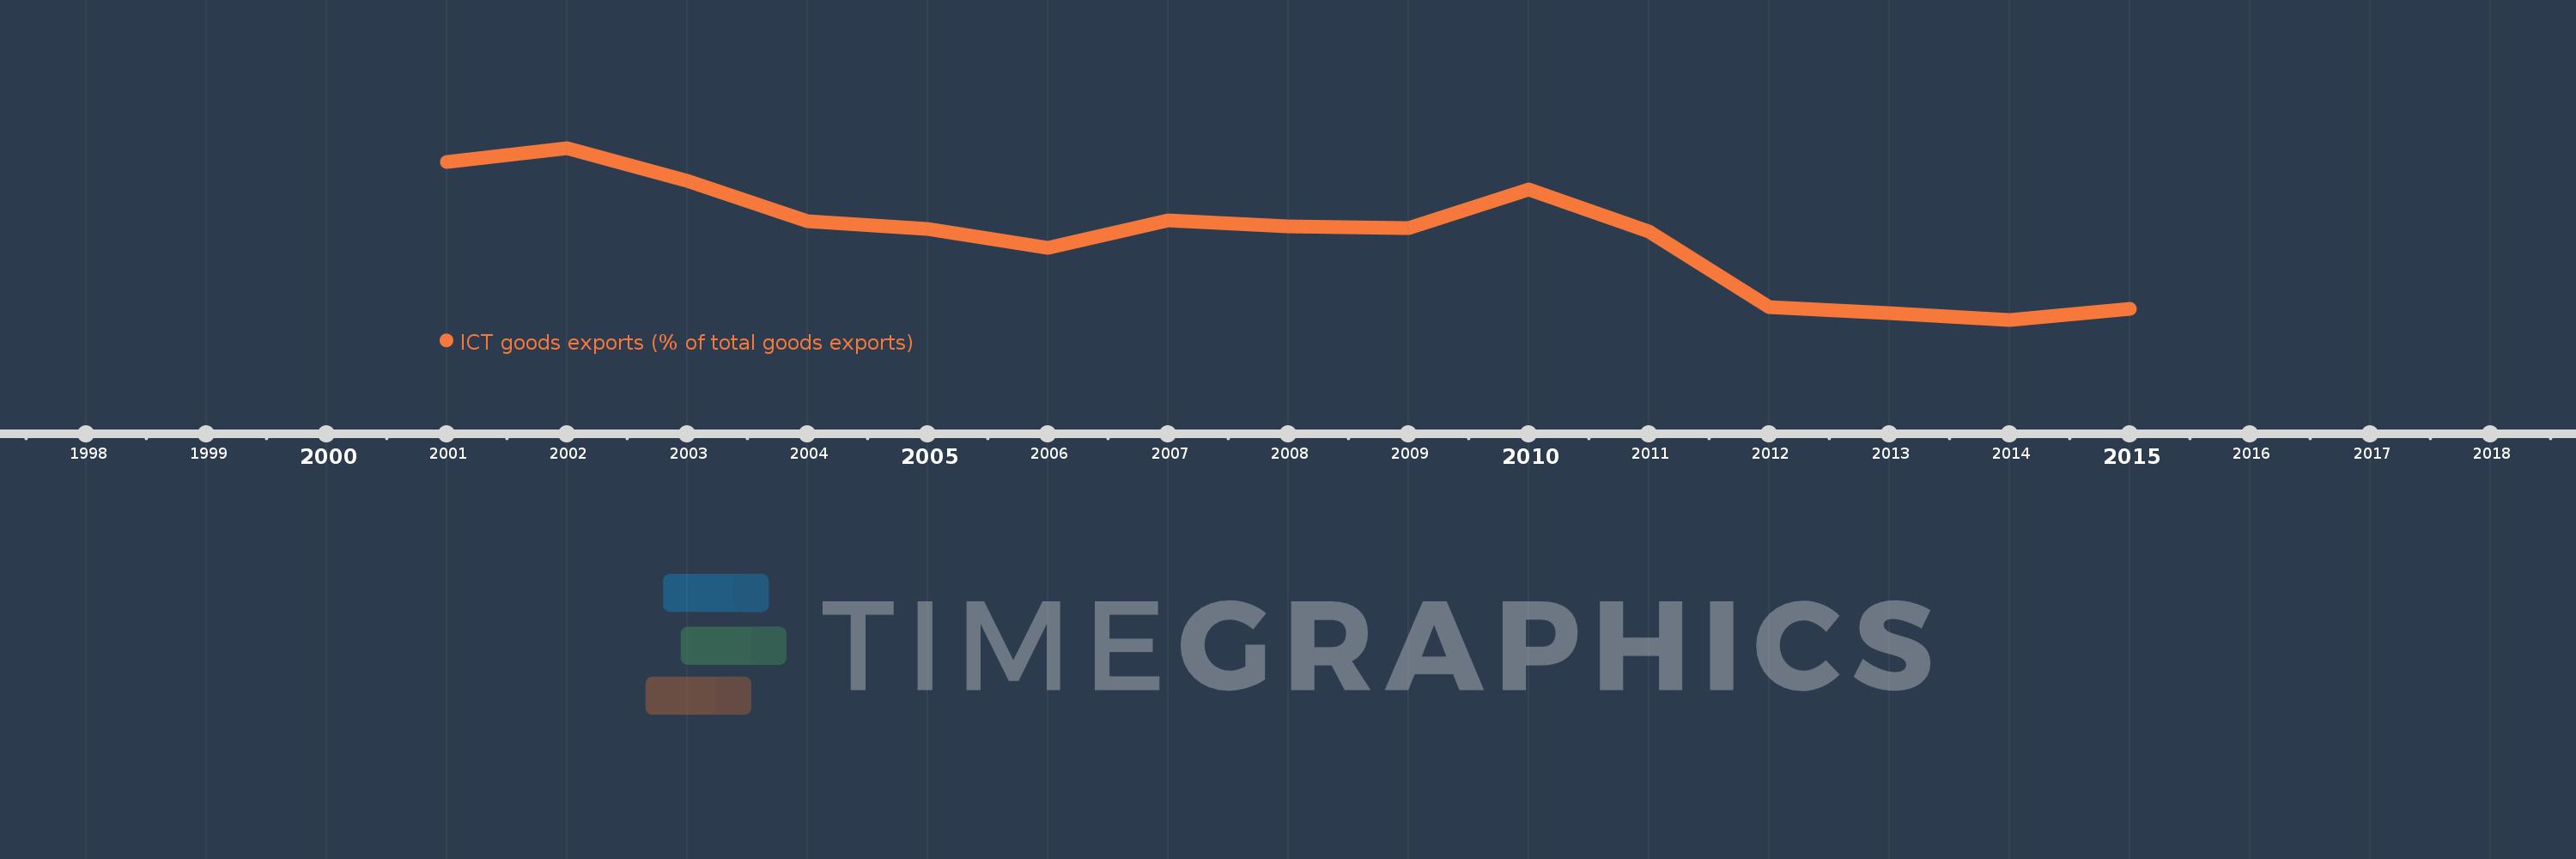
Questa scala temporale mostra un grafico dal 2001 anno al 2015 anno. Latin America & the Caribbean (IDA & IBRD countries). I dati fino ad 2000 anno non disponibili. Il numero di osservazioni attuali secondo i date: 15.
La fonte (nome):
Indicatori dello sviluppo mondiale
La fonte (organizzazione):
United Nations Conference on Trade and Development's UNCTADstat database at http://unctadstat.unctad.org/ReportFolders/reportFolders.aspx.
Categorie:
Infrastructure, Private Sector, Trade
sono stati aggiornati
23 apr 2017 anni
Indicatori delle variazioni dei valori per anni
In media:
7.395
Minima:
6.177
1 gen 2014 anni
Massimo:
8.663
1 gen 2002 anni
Alla data di osservazione
Valore
Variazione assoluta
La variazione rispetto al valore precedente
1 gen 2001 anni
8.464
+8.464
0.0%
1 gen 2002 anni
8.663
+0.199
2.36%
1 gen 2003 anni
8.183
-0.48
-5.54%
1 gen 2004 anni
7.607
-0.577
-7.05%
1 gen 2005 anni
7.488
-0.119
-1.56%
1 gen 2006 anni
7.212
-0.276
-3.68%
1 gen 2007 anni
7.62
+0.408
5.65%
1 gen 2008 anni
7.524
-0.096
-1.26%
1 gen 2009 anni
7.503
-0.021
-0.28%
1 gen 2010 anni
8.057
+0.554
7.38%
1 gen 2011 anni
7.459
-0.598
-7.42%
1 gen 2012 anni
6.358
-1.101
-14.76%
1 gen 2013 anni
6.272
-0.086
-1.36%
1 gen 2014 anni
6.177
-0.095
-1.51%
1 gen 2015 anni
6.334
+0.157
2.55%
Classificazione dei paesi secondo i statistiche attuali per anni