33
/it/
AIzaSyAYiBZKx7MnpbEhh9jyipgxe19OcubqV5w
August 1, 2025
54926
Post-demographic dividend
PST
false
2
1
Labor force with secondary education (% of total)
2015,2014,2013,2012,2011,2010,2002,2001,2000,1999,1998
Download
Biblioteca di statistiche globali →Post-demographic dividend →

Labor force with secondary education (% of total)

Queste statistiche in altri paesi:

AlbaniaAlgeriaAntigua and BarbudaArgentinaArmeniaArubaAustraliaAustriaAzerbaijanBahamas, TheBahrainBarbadosBelarusBelgiumBelizeBermudaBoliviaBosnia and HerzegovinaBotswanaBrazilBritish Virgin IslandsBulgariaCambodiaCanadaCayman IslandsCentral Europe and the BalticsChadChileColombiaCosta RicaCroatiaCubaCyprusCzech RepublicDenmarkDominicaDominican RepublicEarly-demographic dividendEcuadorEgypt, Arab Rep.El SalvadorEstoniaEthiopiaEuro areaEurope & Central AsiaEurope & Central Asia (excluding high income)Europe & Central Asia (IDA & IBRD countries)European UnionFinlandFranceFrench PolynesiaGeorgiaGermanyGhanaGreeceGuatemalaGuyanaHigh incomeHondurasHong Kong SAR, ChinaHungaryIcelandIndiaIndonesiaIran, Islamic Rep.IrelandIsraelItalyJapanJordanKazakhstanKorea, Rep.KosovoKuwaitKyrgyz RepublicLatin America & Caribbean Latin America & Caribbean (excluding high income)Latin America & the Caribbean (IDA & IBRD countries)LatviaLebanonLithuaniaLuxembourgMacao SAR, ChinaMacedonia, FYRMadagascarMalaysiaMaltaMauritiusMexicoMoldovaMongoliaMontenegroMoroccoNamibiaNepalNetherlandsNew CaledoniaNew ZealandNicaraguaNigerNigeriaNorth AmericaNorwayOECD membersOmanPakistanPanamaParaguayPeruPhilippinesPolandPortugalPost-demographic dividendRomaniaRussian FederationRwandaSan MarinoSaudi ArabiaSerbiaSingaporeSlovak RepublicSloveniaSouth AfricaSouth AsiaSouth Asia (IDA & IBRD)SpainSri LankaSt. Kitts and NevisSt. LuciaSt. Vincent and the GrenadinesSwedenSwitzerlandSyrian Arab RepublicTajikistanThailandTimor-LesteTrinidad and TobagoTunisiaTurkeyUgandaUkraineUnited Arab EmiratesUnited KingdomUnited StatesUruguayVenezuela, RBWest Bank and GazaYemen, Rep.

Linea del tempo:

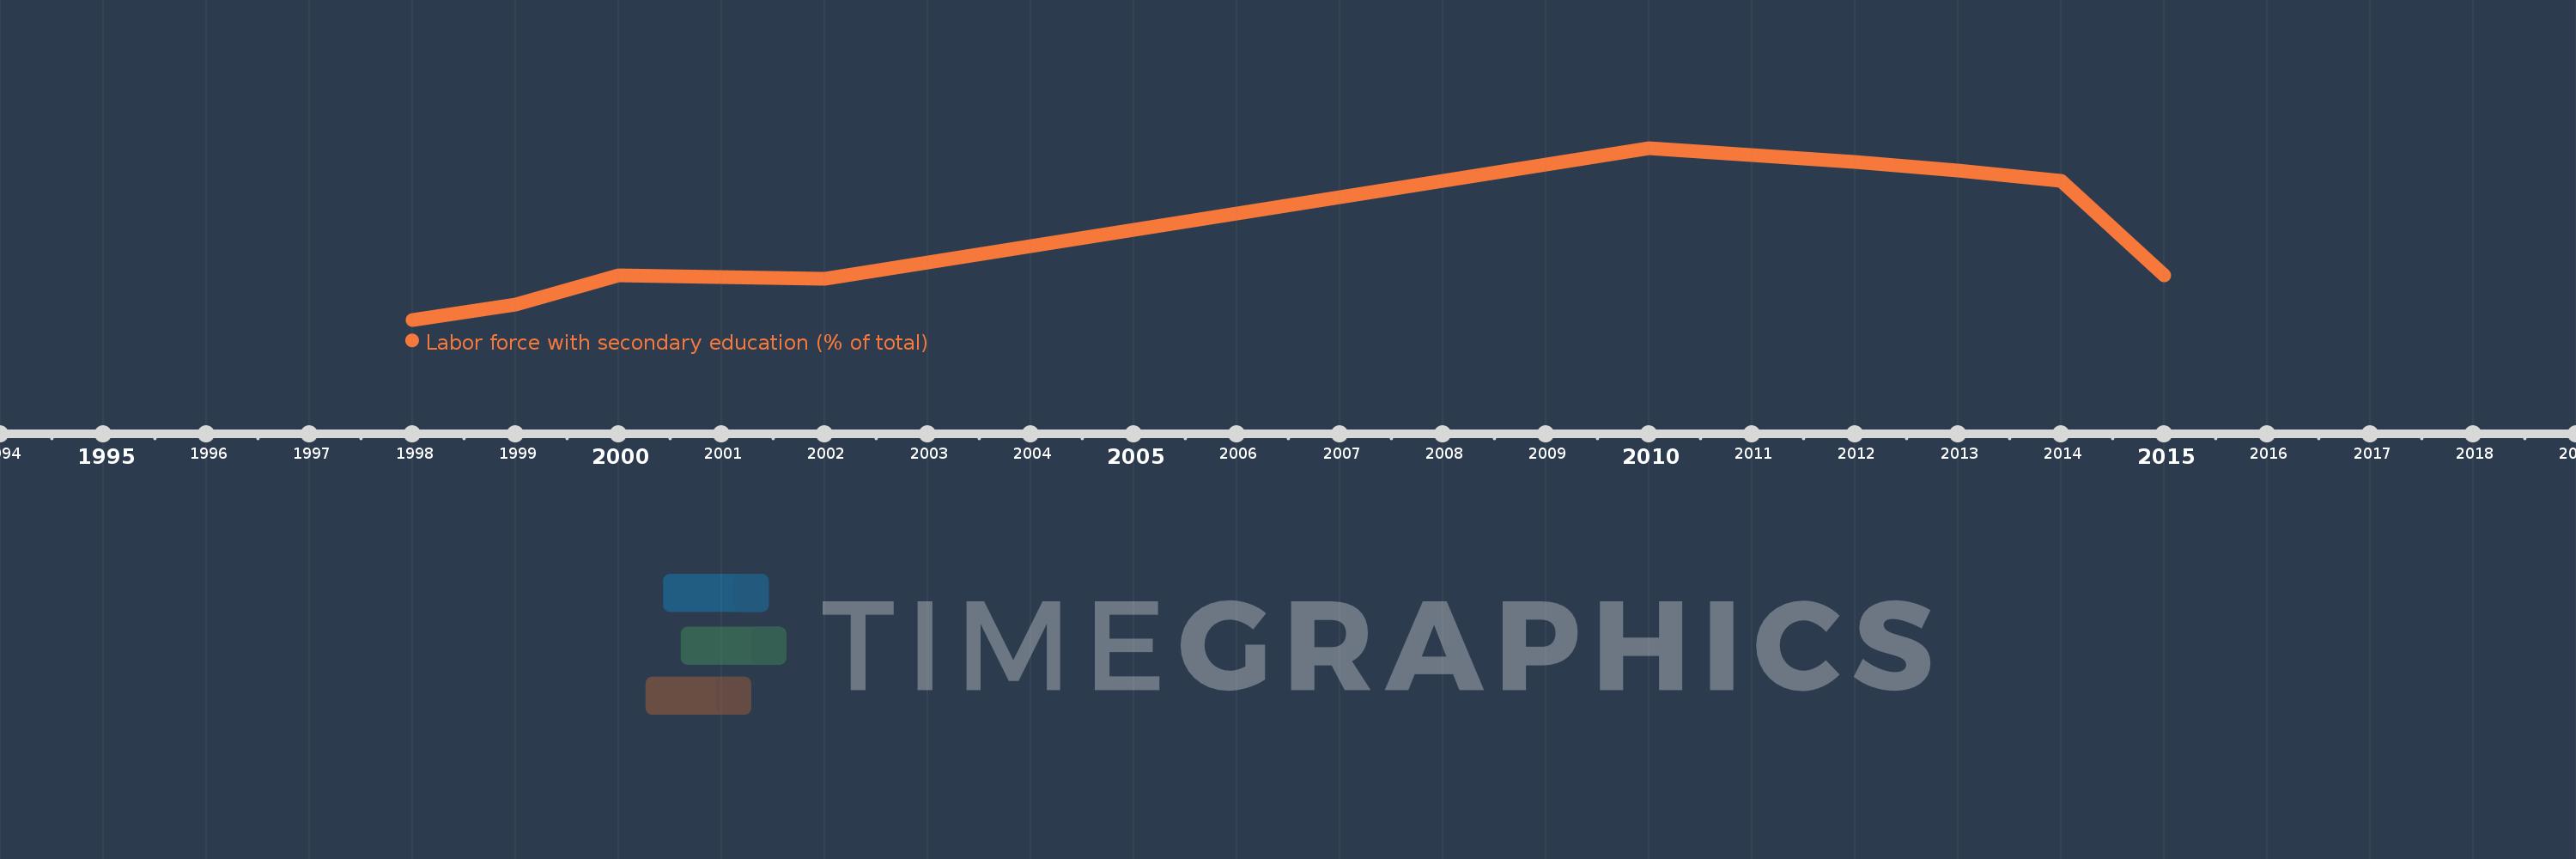
Questa scala temporale mostra un grafico dal 1998 anno al 2015 anno. Post-demographic dividend. I dati fino ad 1997 anno non disponibili. Il numero di osservazioni attuali secondo i date: 11.

La fonte (nome):

Indicatori dello sviluppo mondiale

La fonte (organizzazione):

International Labour Organization, Key Indicators of the Labour Market database.

Categorie:

Education, Social Protection & Labor

sono stati aggiornati

23 apr 2017 anni

Indicatori delle variazioni dei valori per anni

In media:
49.564
Minima:
46.218
1 gen 1998 anni
Massimo:
52.732
1 gen 2010 anni
Alla data di osservazione
Valore
Variazione assoluta
La variazione rispetto al valore precedente
1 gen 1998 anni
46.218
+46.218
0.0%
1 gen 1999 anni
46.779
+0.561
1.21%
1 gen 2000 anni
47.916
+1.137
2.43%
1 gen 2001 anni
47.832
-0.084
-0.18%
1 gen 2002 anni
47.778
-0.054
-0.11%
1 gen 2010 anni
52.732
+4.954
10.37%
1 gen 2011 anni
52.452
-0.28
-0.53%
1 gen 2012 anni
52.207
-0.244
-0.47%
1 gen 2013 anni
51.888
-0.319
-0.61%
1 gen 2014 anni
51.493
-0.395
-0.76%
1 gen 2015 anni
47.906
-3.586
-6.96%

Classificazione dei paesi secondo i statistiche attuali per anni